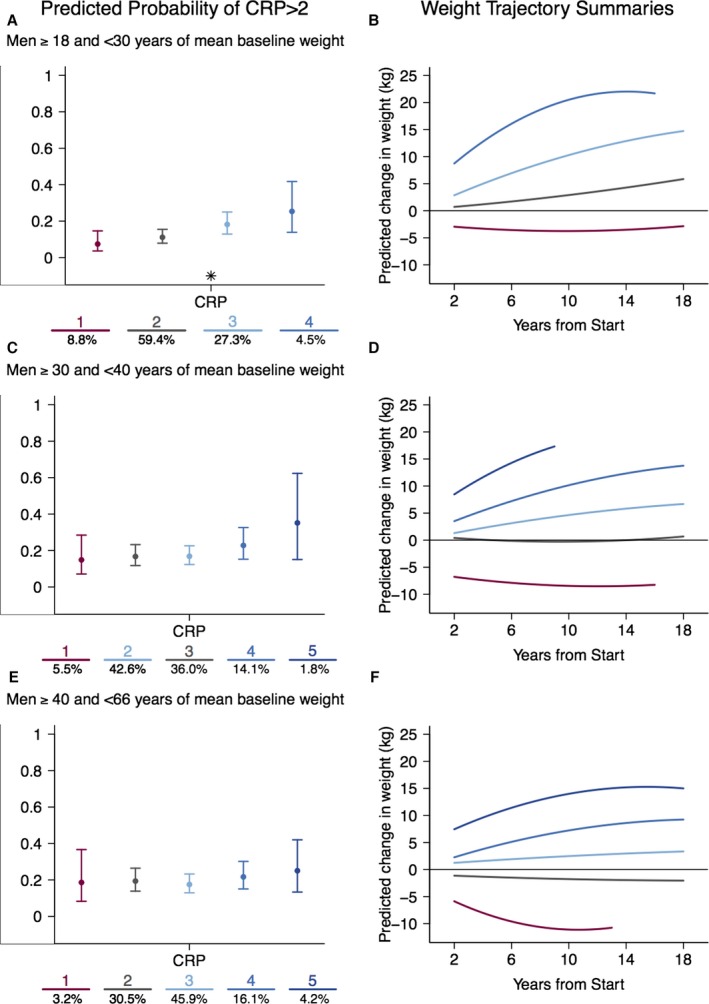
Figure 1.

The probability of elevated hs‐CRP (A, C, and E) by weight‐change trajectory (B, D, and F) across 3 age strata in men: (A and B) 18 to 29 years; (C and D) 30 to 39 years; (E and F) 40 to 66 years. Expected percentage (±95% confidence interval) with elevated hs‐CRP are presented from left to right corresponding to the relative level of weight change in the color‐matched trajectory. For ease of interpretation, trajectories characterized by weight gain are presented in blue, stable trajectories in gray, and weight‐loss trajectories in maroon. The number of participants in each class is presented at the bottom of each figure. The trajectory numbers under graphs in A, C, and E correspond to the similarly colored trajectories in B, D, and F, respectively. Significant effects of the trajectories are indicated with an asterisk. CRP indicates C‐reactive protein; hs‐CRP, high‐sensitivity C‐reactive protein.
