
Figure 5.
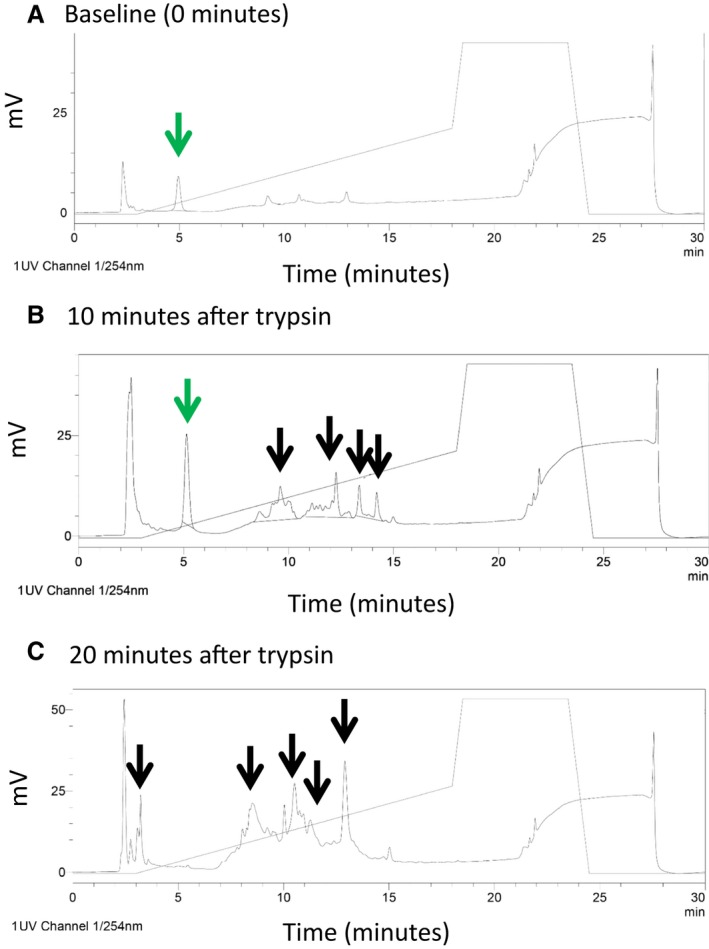
Determination of peptide stability. A, At baseline, a single peak at 5 minutes was noted when V1‐cal was analyzed by reverse‐phase high‐performance liquid chromatography (arrow in green). B, At 10 minutes after trypsin digestion, V1‐cal was still detected (arrow in green) but was 75% degraded, with multiple peaks detected as degradation products of V1‐cal (black arrows). C, At 20 minutes after exposure to trypsin, V1‐cal was 100% degraded (with no peak at 5 minutes and multiple other peaks detected, shown with black arrows).