Figure 6.

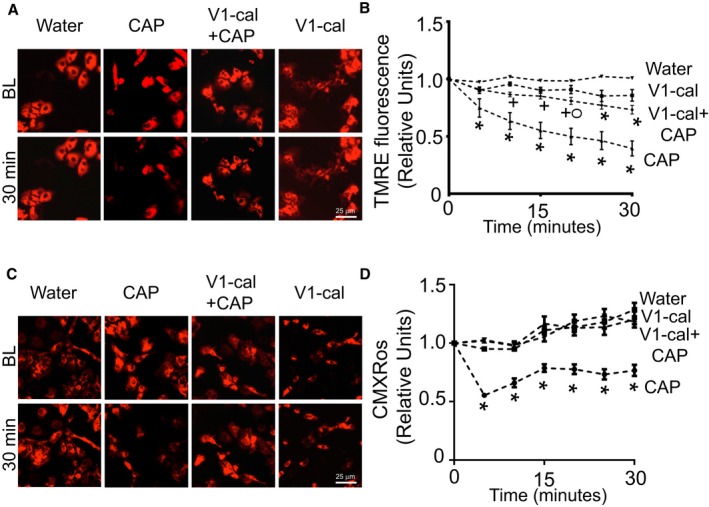
V1‐cal abrogates TRPV1‐induced changes in mitochondrial membrane potential. A, Representative TMRE images of PNCMs at BL and after 30 minutes of treatment with water, CAP, V1‐cal plus CAP, or V1‐cal alone. B, Mitochondrial membrane potential assessed by TMRE for PNCMs treated with V1‐cal (1 μmol/L) prior to CAP (1 μmol/L; n=3 biological replicates per group). + P<0.01 vs CAP alone, O P<0.05 vs water, *P<0.01 vs water. C, Representative CMXRos images of PNCMs at baseline and after 30 minutes of treatment with water, CAP, V1‐cal plus CAP, or V1‐cal alone. D, Mitochondrial membrane potential assessed by CMXRos for PNCMs treated with V1‐cal (1 μmol/L) prior to CAP (1 μmol/L; n=3 biological replicates per group). *P<0.01 vs all other groups. BL indicates baseline; CAP, capsaicin; PNCM, primary neonatal cardiomyocyte; TMRE, tetramethylrhodamine, ethyl ester; TRPV1, transient receptor potential vanilloid 1.
