Figure 2.

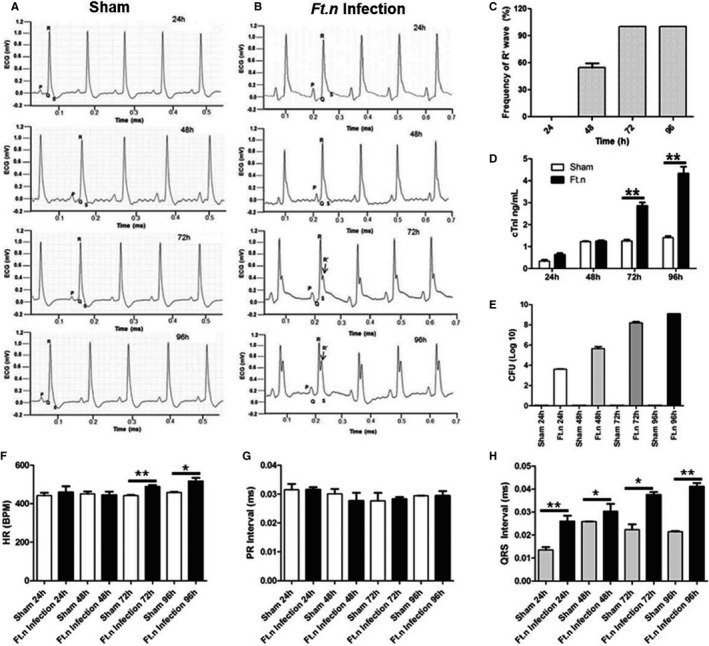
Ft.n infection alters cardiac electrophysiology. Subsurface electrocardiogram (ECG) recordings were obtained from control and Ft.n‐infected mice at baseline and at regular time intervals postinfection (24, 48, 72, and 96 hours postinfection). (A) Representative ECG data from sham‐treated mice (N=4) and (B) are Ft.n‐infected mice (N=4) at different time points (3 independent experiments). After Ft.n infection, note the gradual appearance of an R' wave (black arrow). (C) R' wave frequency was determined in 3 independent experiments (total number of mice=12). From 20 minutes of recorded ECG data, we calculated frequency of R' wave formation at different time points. (D) Serum cardiac troponin‐I levels were determined in sham‐ and Ft.n‐treated mice at different time points. (E) Bacterial burden in lungs was determined by CFU assay using lung homogenates from 4 mice in each group. From 20 minutes of recorded ECG data, we calculated average heart rate (F), PR intervals (G), and QRS intervals (H). Graphs are cumulative data from 4 mice per group and representative of 2 independent experiment (*P<0.05; **P<0.005; ***P<0.0005). BPM indicates beats per minute; CFU, colony forming unit; CTnI indicates cardiac troponin‐I; HR, heart rate.
