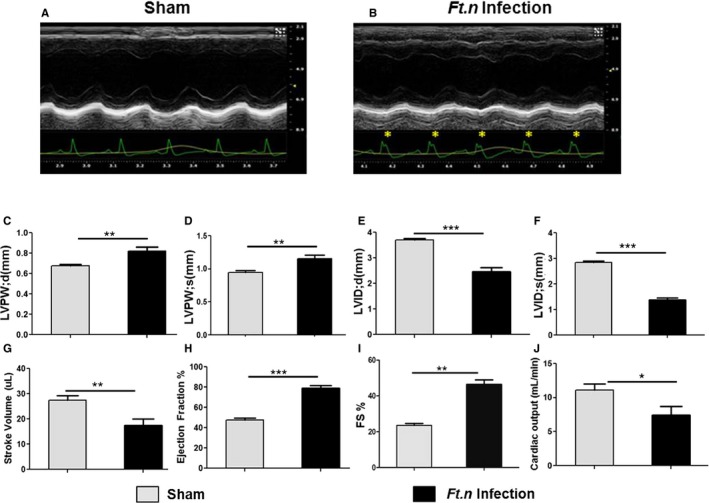
Figure 3.

Cardiac pump dysregulation following Ft.n infection. To assess cardiac function in vivo, two‐dimensional echocardiography was performed at baseline and at 96 hours postinfection. (A) Representative cardiac patch of uninfected mice (N=9) and (B) a cardiac patch at 96 hours post‐Ft.n infection (N=9). Note the presence of a prominent R' wave present in Ft.n‐infected mice (yellow asterisks). Posterior ventricular wall thickness (LVPW; d and LVPW; s) during (C) diastole and systole (D), left ventricular internal diameter during (E) diastole (LVID; d) and (F) systole (LVID; s), (G) stoke volume, (H) ejection fraction, (I) % fractional shortening (FS), and (J) cardiac output were determined from sham‐treated and Ft.n‐infected mice. N=3 (3 mice/group; *P<0.05; **P<0.005; ***P<0.0005).
