Figure 8.

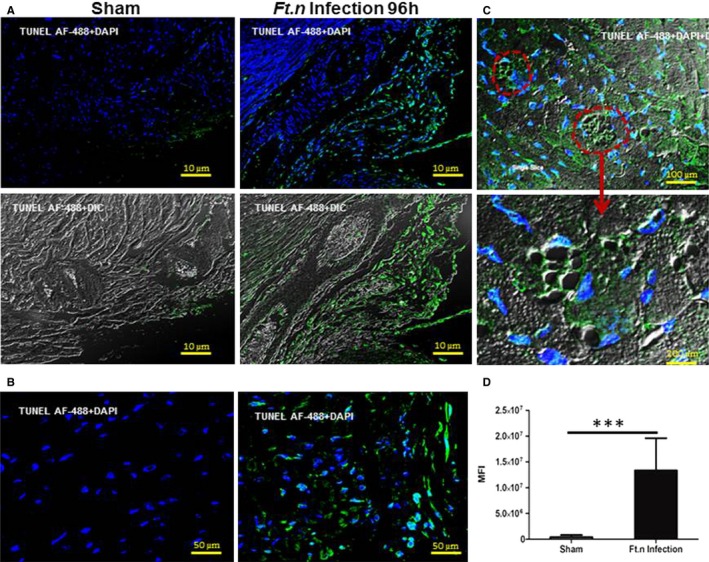
Apoptosis of heart tissue during Ft.n infection. Heart sections from sham‐ and Ft.n‐infected mice were deparaffinized by xylene, and apoptotic cells were stained by the Click‐it plus TUNEL assay kit with Alexa Fluor 488 dye. (A) Representative image from the posterior region of heart sections of sham‐treated mice (right panel) and Ft.n‐infected mice (left panel). (B) Representative image of the septa region of Ft.n‐infected mice. (C) Representative image from the microlesion in septa region of Ft.n‐infected heart sections. Lower panel shows an enlarged image of microlesions in an Ft.n‐infected heart section. Dotted circle shows a lesion caused by Ft.n infection. (D) Graph shows cumulative data of mean florescent intensities (MFI) of apoptotic cells (AF488; N=3; 10 images/mouse; ***P<0.0005). AF488 indicates Alexa Fluor 488; DAPI, 4',6‐diamidino‐2‐phenylindole; DIC, differential interference contrast; TUNEL, terminal deoxynucleotidyl transferase dUTP nick end labeling.
