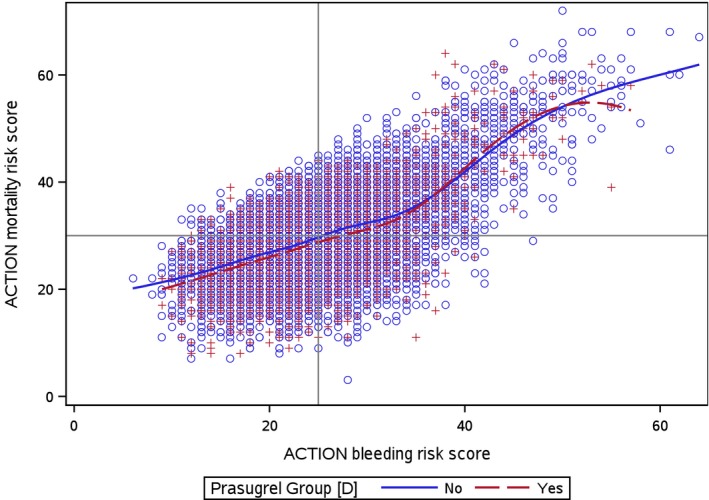
Figure 3.

Correlation of ACTION mortality and bleeding risk scores, stratified by ADPri selection. This figure represents a scatter plot of all patients by ACTION mortality and bleeding risk score stratified by initial ADPri selection (red=prasugrel, blue=clopidogrel). The horizontal line and vertical line represent the median ACTION mortality and bleeding risk scores, respectively. Penalized B‐splines curves were created for clopidogrel and prasugrel. ADPri indicates ADP receptor inhibitor. ACTION indicates Acute Coronary Treatment and Intervention Outcomes.
