Figure 1.

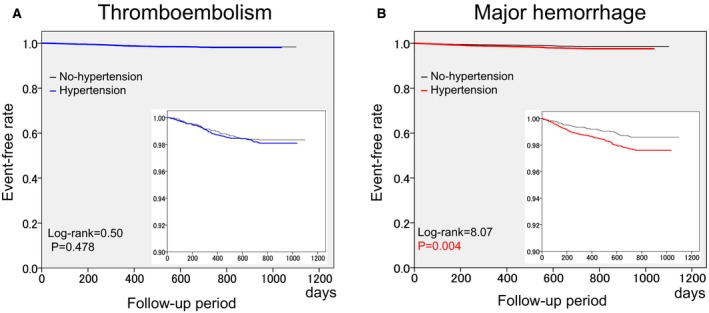
Kaplan–Meier curves of thromboembolism (A) and major hemorrhage (B). Additional boxes show the magnified event‐free curves with 10‐fold scale. P‐values: comparison between No‐hypertension and Hypertension groups by log‐rank test.

Kaplan–Meier curves of thromboembolism (A) and major hemorrhage (B). Additional boxes show the magnified event‐free curves with 10‐fold scale. P‐values: comparison between No‐hypertension and Hypertension groups by log‐rank test.