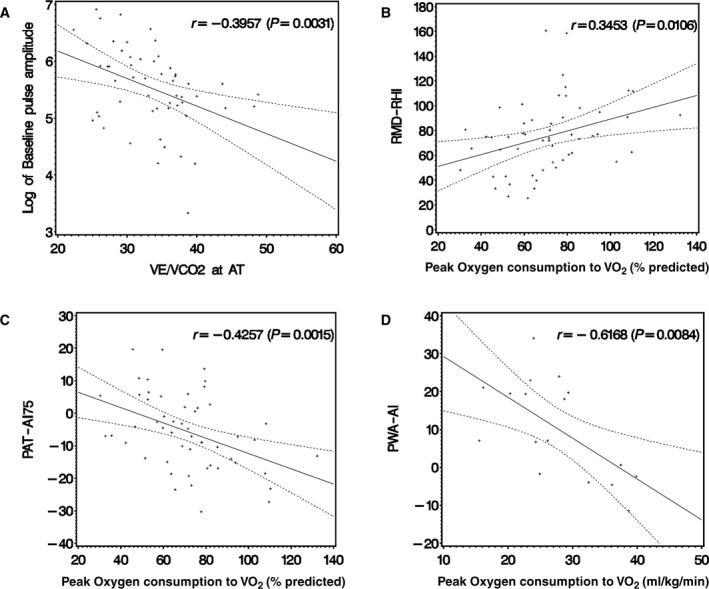
Figure 1.

Scatterplots of vascular function parameters vs measures of exercise performance. A, Peripheral arterial tonometry–derived baseline pulse amplitude (PAT‐BPA) vs ventilatory equivalents of carbon dioxide (VE/VCO 2) at anaerobic threshold (AT). B, Flow mediated vasodilation–derived reactive hyperemia index (FMD‐RHI) vs percentage of predicted peak oxygen consumption (VO 2). C, PAT‐derived augmentation index at 75 beats per minute (PAT‐AI75) vs percentage of predicted peak VO 2. D, Pulse wave analysis–derived augmentation index (PWA‐AI) vs peak VO 2. In each case, there was a significant correlation between vascular and exercise measures. Regression line and 95% CI are depicted.
