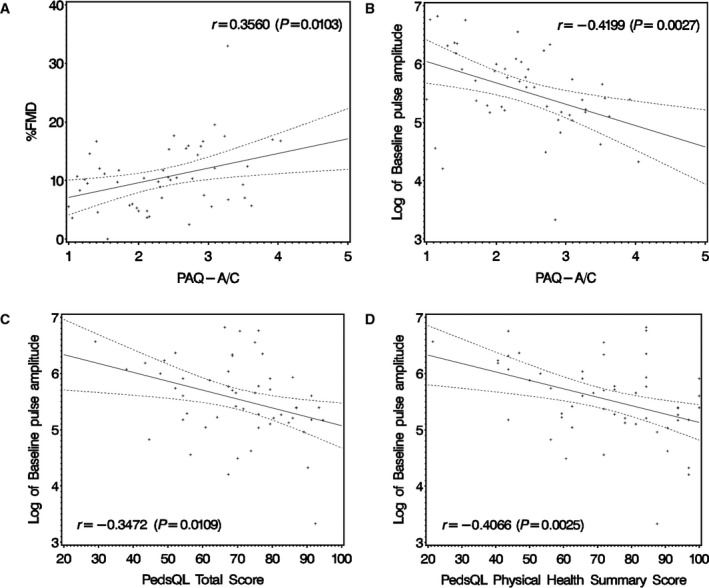
Figure 2.

Scatterplots of vascular function parameters vs measures of physical activity and quality of life. A, Percentage of flow‐mediated vasodilation (%FMD) vs Physical Activity Questionnaire for Adolescents and for Older Children (PAQ–A/C) score. B, Peripheral arterial tonometry–derived baseline pulse amplitude (PAT‐BPA) vs PAQ score. C, PAT‐BPA vs Pediatric Quality of Life Inventory (PedsQL) score (parent‐proxy report). D, PAT‐BPA vs PedsQL physical health summary score (parent‐proxy report). In each case, there was a significant correlation between vascular and physical activity or quality of life measures. Regression line and 95% CI are depicted.
