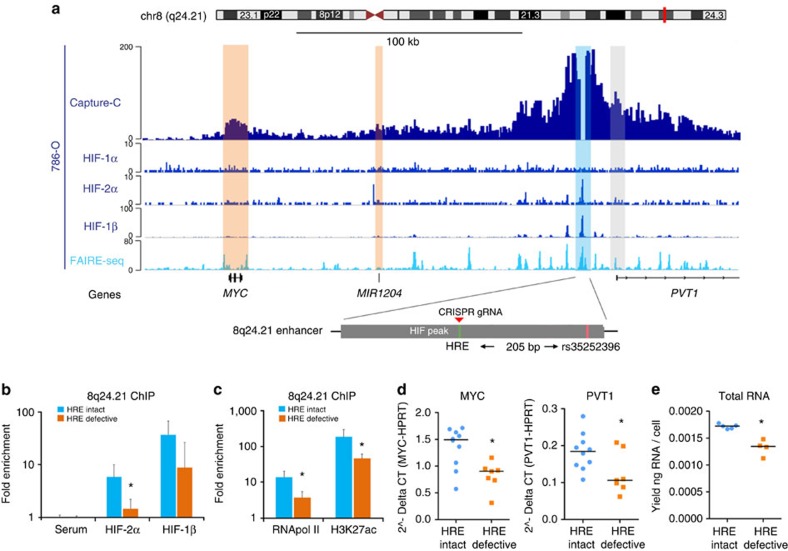
Figure 3. Functional analysis of the RCC associated 8q24.21 enhancer.
(a) Capture-C assay reveals chromatin interactions between the 8q24.21 enhancer (anchor site, highlighted in light blue) and the MYC promoter (significant interactions highlighted in light orange) in 786-O cells. Interactions were also observed with the PVT1 promoter, but did not reach statistical significance (highlighted in grey). HIF ChIP-seq shows HIF-1β and HIF-2α binding in 786-O cells that lack functional HIF-1α. Positions of the central HRE, the associated SNP rs35252396 (205 bp downstream of the HRE) and the guide RNA used in CRISPR/Cas9 experiments are shown below the tracks. (b) HIF ChIP–qPCR confirmed reduced binding of HIF-2α (*Student's t-test, P<0.05) and HIF-1β (Student's t-test, P=0.09) to the 8q24.21 enhancer in 786-O HRE-defective cells. Data are shown in a log scale and are mean±s.d. from three independent clones of cells with intact or defective HRE, respectively. (c) qPCR using RNApol2 and H3K27ac ChIP samples reveals lower levels of marks of active chromatin at the 8q24.21 enhancer in 786-0 HRE-defective cells. Data are shown in a log scale and are mean±s.d. from three independent clones of cells with intact or defective HRE. *One-sample t-test, P<0.05. (d) RNA levels of MYC and PVT1 in 786-O cells with defective HRE (n=7) or intact HRE (n=10). Values represent mean from three independent RNA isolations for each clone. *Student's t-test, P<0.05, comparing the two groups of cells. (e) Total RNA levels are lower in HRE-defective cells. Each dot represents the mean yield of RNA per cell calculated from two to three independent RNA isolations from 50.000 cells per clone of cells. Values are from four (HRE-defective) or five (HRE-intact) clones of cells. *Student's t-test, P<0.05.

