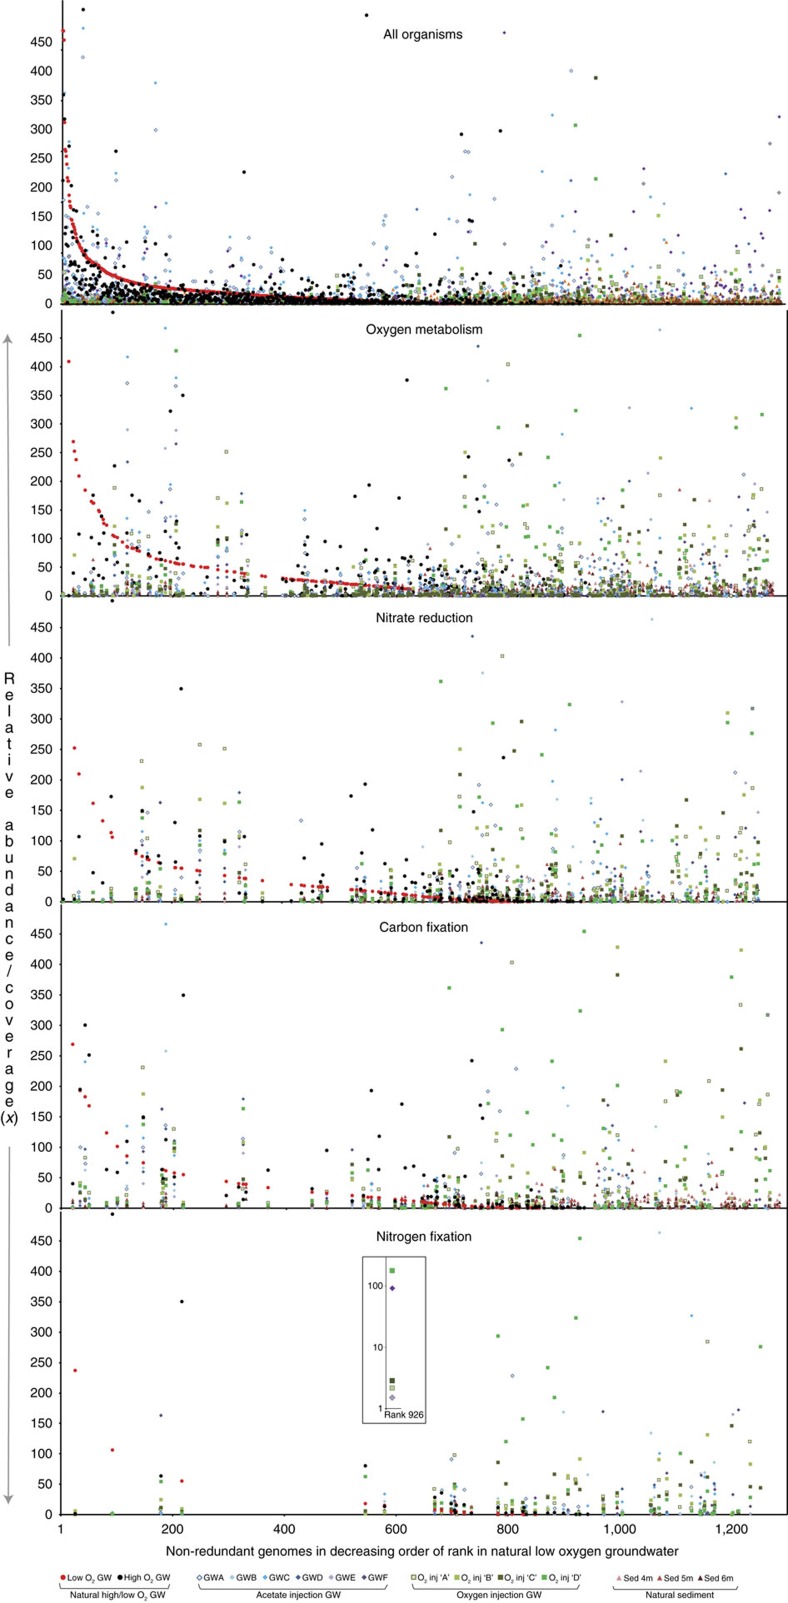
Figure 3. Rank abundance plots highlighting organisms putatively involved in geochemical cycling across 15 different geochemical regimes in the aquifer.
Rank abundance curves were computed using whole-genome coverage estimated by read mapping. Organisms with genome coverage greater than 500x are not shown. Symbols represent different perturbations/sample sources: circles: natural high/low-oxygen groundwater; diamonds: acetate injection into groundwater; squares: oxygen injection into groundwater; triangles: natural unamended sediment. Y axis represents the normalized relative abundance in the community (genome coverage normalized to the natural low-oxygen groundwater sample). Panels representing specific metabolisms (oxygen metabolism, nitrate reduction, carbon fixation and nitrogen fixation) only show organisms inferred to have that capacity. Inset figure highlights the variation in abundance of a single Sulfuricurvum species (Sulfuricurvum sp. RIFOXYD12_FULL_44_77) that appears to be able to fix carbon and nitrogen, across the different geochemical conditions. GW, groundwater. For groundwater, only samples collected on the 0.2 μm filters are shown.

