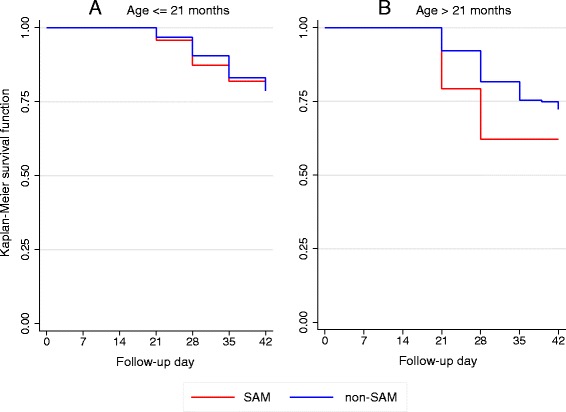
Fig. 2.

Kaplan–Meier curves of reinfection-free survival until day 42 in severe acute malnutrition (SAM) and non-SAM children, stratified by age. a Children ≤ 21 months. b Children > 21 months. Results are displayed for the modified intent-to-treat population (N = 397). Age strata are defined by the median value of 21 months. The log-rank tests for equality of survival functions are displayed hereafter: a P = 0.4836 at day 28, P = 0.7845 at day 42. b P = 0.0131 at day 28, P = 0.1684 at day 42
