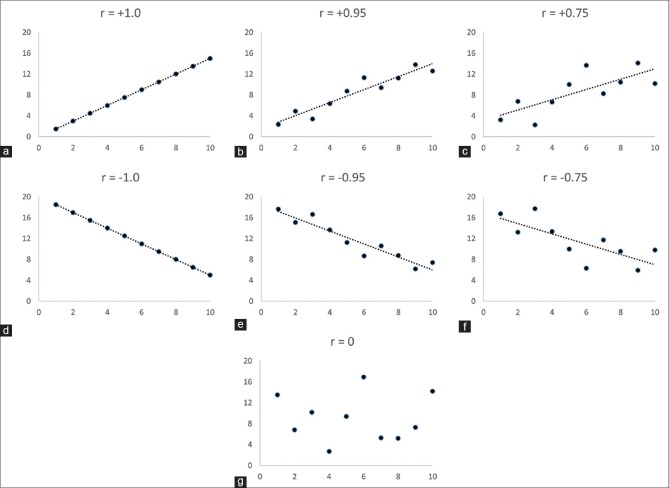
Figure 1.
Scatter plots of relationship between values of two quantitative variables and their corresponding correlation coefficient (r) values. “r” can vary between − 1.0 and + 1.0. If as the values of one variable (say on X-axis) increase, those of the other variable (on Y-axis) increase, “r” is positive (a-c); however, if the latter decrease, “r” is negative (d-f). When the values of two variables have no clear relation, “r” is zero (g). The absolute values of “r” are higher when the individual data points are closer to a line showing the linear trend (a > b > c; d > e > f)

