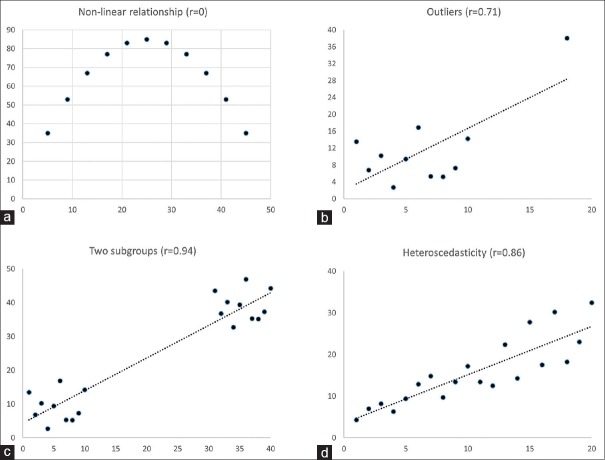
Figure 2.
Situations in which linear correlation should not be used: (a) two variables have a relationship which is nonlinear (analysis of data points in this figure shows r = 0, thus failing to detect the relationship), (b) the data have one or a few outliers (one outlier at right upper end resulted in a false relationship with r = 0.71; exclusion of this point reduces r to near zero), (c) when the data have two subgroups, within each of which there is no correlation, and (d) when variability in values on Y-axis changes with values on X-axis. Each situation is described further in the text

