

Abstract
Background
Previous studies indicate that seasonal variation affects daily physical activity (PA), but none have investigated this relationship in individuals with heart failure (HF) who also have implanted cardioverter defibrillators and cardiac resynchronization therapy (ICD/CRT) devices. The purpose of the present study was to determine if seasonal variation in temperature affects daily PA in patients with HF and ICD/CRTs.
Patients and methods
Secondary analysis of data from 16 subjects with HF and Medtronic® ICD/CRT devices enrolled in a randomized trial investigating interventions to improve daily PA. Due to the rolling study enrollment, daily PA data for all subjects were not available for the entire time frame and were divided into two groups. Determination of seasonal variation of daily PA was determined using visual analysis of daily PA plotted with average temperature, autocorrelation, visual analysis of seasonal subseries plots and boxplot analysis, as well as Wilcoxon signed-rank tests.
Results
Subjects 1-8 demonstrated the greatest differences in daily PA during periods of seasonal transition whereas subjects 9-16 demonstrated the greatest variation in daily PA with greatest seasonal temperature difference. Wilcoxon signed-rank testing of the lowest and highest months for daily PA revealed median differences of 0.30 (p = 0.050) and 0.36 hours (p = 0.036) for subjects 1-8 and 9-16, with effect sizes of 0.69 and 0.74, respectively.
Conclusions
Seasonal variation in mean temperature appears to affect daily PA in individuals with HF and ICD/CRT devices by a magnitude of 0.30-0.36 hours, which may need to be accounted for in future research investigating interventions to improve daily PA.
Keywords: Cardiac resynchronization therapy, Daily physical activity, Heart failure, Implanted cardioverter defibrillator
Introduction
In individuals with heart failure (HF) and who also have implanted cardioverter defibrillators and cardiac resynchronization therapy (ICD/CRT) devices, low daily physical activity (PA) leads to poorer prognosis (1) and increased mortality (2, 3). Identification of effective interventions for improving daily PA in this population is important; however, few studies have been able to demonstrate large effect sizes (4). To our knowledge, no prior study has accounted for the potentially confounding effect of seasonal change on daily PA. Therefore, a better understanding of the way in which seasonal change affects daily PA is needed in the future to assist clinical trial design and in clinical interpretation of changes in daily PA over time.
Current literature demonstrates a small but statistically significant effect of weather variables on daily PA in various populations including COPD (5), community dwelling elderly (6-7-8-9), healthy adults (10-11-12), and functionally impaired elderly (13). However, within these studies, there is wide variation in the definition of daily PA (e.g. total daily caloric expenditure vs. structured PA), weather variables examined, use of objective measures of daily PA, and time frame of activity measurement. Additionally, no studies have examined the potential effect of weather on daily PA in individuals with HF.
A consistent use and definition of terminology is lacking. The majority of studies cited in the present study utilized the term “physical activity”, with most generally referring to overall quantification of movement in a day (vs. only structured PA/exercise), though many did not specifically state their operational definition. For the present study, daily PA is defined as the sum of both structured and unstructured PA, where structured PA is intentional use of activity to promote health and fitness and incidental PA is that which is not planned and is the result of daily physical activities at work, home, or during transportation (14).
With regard to the effect of various weather variables on daily PA in healthy community dwelling adults and elderly, prior research is somewhat conflicting. In Scotland, Witham et al (9) found that as day length increased by 1 hour, daily PA increased by 0.9%, whereas another study in Germany found no significant effect of day length on daily PA, but did find an effect of global radiation on daily PA (7). In Japan, Chan et al (10) found that precipitation, specifically rainfall greater than 14 mm and snow accumulation over 10 cm resulted in an 8% and 3.6% decrease in daily PA, respectively.
In addition, data regarding the specific association between temperature and activity are conflicting. A London-based study of 73 individuals with COPD found that a temperature rise of 1°C accounted for an increased step count of 43 steps per day until temperature reached 22.5°C, after which activity decreased by 891 steps per additional 1°C rise in temperature (5). Similarly, in 41 Japanese community dwelling healthy elderly, step count increased within an ambient temperature range of -2°C to 17°C and decreased over a range of 17°C to 29°C (8). In community dwelling elderly in Canada, daily PA peaked at 20°C and decreased with temperatures above 30°C (6). Although these studies indicate a potential effect of weather on daily PA levels, there is no agreement regarding the thresholds for temperature and temperature change that result in changes in daily PA.
When considering a more general effect of seasonal change on daily PA, similar conflicting results exist. In Germany, Klenk et al (7) found that season was not associated with a significant change in walking duration; however, Hagströmer et al (11) (Sweden), Sumukadas et al (13) (United Kingdom), Berstralh et al (15) (northern USA), and Tudor-Locke et al (16) (southeastern USA) all found a seasonal variation in daily PA, although there was not agreement on the time of year and the magnitude of the variation. Hagströmer et al (11) studied 1172 healthy adults and reported that total daily PA was higher during the spring than in the fall, whereas Sumukadas et al (13) studied 127 community dwelling elderly and found that daily PA was highest in June and lowest in February. Berstralh et al (15) found that activity peaked in August and was lowest in February with season accounting for 21% of the variance in daily PA, and Tudor-Locke noted peak daily PA in September and a trough in December, though the magnitude of this variation was only 10%. Similar to Hagströmer et al (11), Merchant et al (12) found that self-reported daily PA in Canada was 31% higher in summer and the frequency of episodes of daily PA lasting at least 15 minutes was 72% higher in summer compared to winter.
All but two studies (12, 15) utilized objective measurement of PA, although there was a wide variety of instrumentation for measuring activity, including the Yamax Digi-Walker (5), ActiGraph (6, 11), RT3 Triaxial accelerometer (9, 13), activPAL (7), and Yamax SW-200 (10, 15). The amount of time the devices were worn varied greatly from 7-450 days as did device placement, including the lateral hip, anterior hip, or thigh. These differences in the duration of activity measurement, the location of the accelerometer, location of the study, as well as different instrumentation makes it difficult to broadly draw conclusions across different studies.
Although there is some evidence in the literature that seasonal change may affect daily PA, there are conflicting results regarding the extent to which seasonal change affects daily PA, and there are no prior studies that have examined this effect in individuals with HF. Therefore, the purpose of the present pilot study was to determine if there is a seasonal change in daily PA in community dwelling individuals with HF who also have ICD/CRT devices. We hypothesized that there would not be a significant seasonal effect on daily PA in this sample.
Methods
Study design
This is a secondary analysis of the first 16 subjects to complete the 3-month follow-up testing for a randomized trial investigating interventions to improve daily PA in patients with HF and ICD/CRT devices (clinicaltrials.gov ID NCT02331524). The purpose of the single-blinded randomized trial was to investigate the effect of two different intervention approaches on daily PA, exercise tolerance, HF-related health status, and lower extremity functional strength. Subjects were randomized to one of three groups: 1) a health coaching/home exercise group that was provided weekly home visits by a health coach and a physical therapist for 3 months, 2) a feedback group where the patient was provided a FitBit® along with weekly feedback and encouragement for 3 months, and 3) a usual care group.
Subjects
The first 16 subjects to complete the 3-month follow-up were included in the analysis. Study inclusion criteria were: adults aged 40 and over, diagnosis of HF with subsequent implantation of a Medtronic® ICD or CRT device at least 6 months prior to study enrollment, and a New York Heart Association-Functional Classification (NYHA-FC) II to III symptoms on optimal medical therapy. Additionally, the subjects did not meet any of the exclusion criteria of the original study which were: any co-morbid medical disease that would prevent safe participation in an individualized exercise program such as severe osteo-, rheumatoid-, and gout-related arthritis, unstable angina, exercise-induced arrhythmias, uncontrollable diabetes, atrial fibrillation with rapid ventricular rate in the preceding 30 days, recent (<6 weeks) or planned (<6 months) major cardiovascular events or procedures, current participation in a regular exercise training program, and HF due to severe, uncorrected primary valvular disease, congenital heart disease, or obstructive cardiomyopathy. The study protocol was approved by the institutional review boards of Grand Valley State University and Spectrum Health. Informed consent was obtained from each subject and all study procedures ensured that the rights of the subjects were protected.
Sources of data
Medtronic® ICD and CRT devices contain a single-axis accelerometer oriented in a sagittal/anterior-posterior (z-axis) axis that records the number of daily minutes in which the patient exceeded an activity level equivalent to approximately 70 steps per minute. The data are stored in the device for a rolling 14-month period and can be extracted during a “save-to-disk” device interrogation. “Patient Activity” is also reported as a weekly average and is graphically displayed for a 14-month period on clinical interrogation reports. Daily PA data from the Medtronic ICD/CRT devices were extracted using the Medtronic Paceart® software and converted to an Excel spreadsheet using a Medtronic proprietary conversion tool or through Medtronic proprietary conversion of Carelink® interrogation data. Daily PA data were available for subjects starting December 2013 through December 2016. However, due to the rolling study enrollment, daily PA data for all subjects was not available for that entire time frame. Therefore, the analyses were conducted using the subject subgroups as described below. Previously reported minimal clinically important difference (MCID) for the Medtronic® Patient Activity measure is 1.08 hours or 64.8 minutes per day (1).
Weather data for the nearest weather recording station within 30 miles of subjects’ residences (Grand Rapids, MI, USA) for December 2013 through December 2016 was obtained from Weather Underground (www.wunderground.com) and included the maximum, minimum, and average temperature, humidity, atmospheric pressure, and wind speed, as well as amount of precipitation.
Statistical analysis
Data selection and management
The available daily PA data in the dataset were examined to determine the longest continuous time frames for which activity data were available for all subjects and/or subgroups. This resulted in selection of two time periods: January 2014 to January 2015 for subjects 1-8, and February 2014 to October 2015 for subjects 9-16. Additionally, daily PA data for each subject were carefully examined using study and medical record information to identify time frames where daily PA was affected by hospitalizations (where activity drops to near 0 hours per day) or intervention effect (identified by an increase in overall biweekly average of greater than 1 hour per day). Daily PA data points affected by hospitalizations or intervention effects were imputed using the average of the preceding two weeks. Adjustments for hospitalizations were required for four subjects and intervention effects for only one subject.
The weather data were examined using autocorrelation (described below) to identify the weather variables that had the clearest pattern of seasonality. As expected, a clear pattern of seasonality of weather data only emerged for the temperature variables. Therefore, only average temperature was used for analysis as average temperature was felt to most accurately reflect the season.
Analytical approaches
Multiple approaches were used to assess the presence and magnitude of a seasonal effect (17) on daily PA, including visual analysis of daily PA plotted with average temperature, autocorrelation (18), visual analysis of seasonal subseries plots (19) and boxplots (17), as well as Wilcoxon signed-rank tests (20).
With regard to visual analysis, biweekly averages for daily PA and temperature were plotted on dual y-axes against calendar dates on the x-axis for the two timeframes/data groupings: Subjects 1-8 and 9-16.
As noted above, autocorrelation of average temperature was used to identify relevant seasonal timeframes and appropriate lags to be used when performing autocorrelation of daily PA for subjects 1-8 and 9-16. Autocorrelation is a technique that can be used for detecting seasonality in time series data by measuring the correlation of time series data with itself by calculating the correlation between any two points in time across a specified number of time lags (18). In the present analysis, average temperature and average daily PA were calculated for each week. Fifty-four and 34 weeks of data were available for subjects 1-8 and 9-16, respectively, and therefore lags of 53 and 33 were used for each respective group.
Seasonal subseries plot analysis plotted monthly and weekly average daily PA for subjects 1-8 and 9-16. Seasonal subseries plots are a visual technique for detecting seasonality in time series data by revealing weekly and monthly trends (19). Boxplots for monthly and weekly average daily PA were analyzed visually for seasonal trends (17).
Seasonal high and low months of daily PA were selected based on the aforementioned analyses and compared using Wilcoxon signed-rank tests to determine whether there was a statistically significant difference in activity levels between seasons. Post-hoc effect size was calculated as r = Z/√N (21).
Results
Demographics for the sample are presented in Table I. Figure 1 depicts the average temperature plotted against daily PA for subjects 1-8 and 9-16. Subjects 1-8 were generally more active than subjects 9-16. A seasonal pattern is evident with the lowest activity time points occurring with the lowest average temperatures, which were January 2014 and 2015 for subjects 1-8 and February 2015 for subjects 9-16. Daily PA then increased along with increasing temperature. In subjects 1-8, daily PA increased up to approximately 15°C, then generally leveled until temperatures again decreased below 15°C.
TABLE I -.
Subject demographics
| Subjects 1-8 | Subject 9-16 | Overall (n = 16) | |
|---|---|---|---|
| Values are percentage or median (interquartile range); There were no between-group differences at p<0.05; BMI = Body mass index; LVEF = left ventricular ejection fraction; NYHA-FC = New York Heart Association-Functional Class. | |||
| Age | 59 (12.8) | 71 (17.8) | 66 (14) |
| Gender (% male) | 50 | 62.5 | 56.2 |
| BMI (kg/m2) | 37.9 (18.6) | 29.0 (10.2) | 29.8 (13.6) |
| LVEF (%) | 32 (16.75) | 28.0 (12) | 30 (17) |
| NYHA-FC | 2 (1) | 2 (1) | 2 (0.75) |
| Etiology (% ischemic) | 62.5 | 75 | 68.8 |
| Total # of comorbidities | 5.5 (2.8) | 6.0 (3) | 6 (3) |
| Total # of medications | 13.0 (8.3) | 12.5 (10.8) | 13 (7) |
Fig. 1 -.
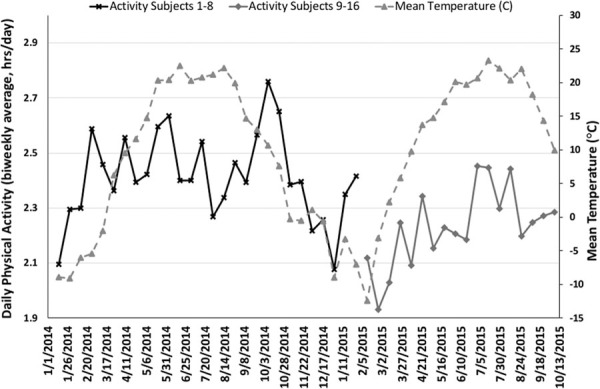
Average temperature plotted against daily activity.
The upper panels in Figures 2 and 3 depict the autocorrelation plots of average temperature and the lower panels depict the autocorrelation of average daily PA for each week, which allowed for identification of the peak differences in temperature and daily PA, as well as the timing of seasonal transition/change. For subjects 1-8 (Fig. 2), seasonal transition/change occurred at lags 12 (early April 2014) and 37 (late September 2014) with the greatest seasonal difference occurring at lags 22 (mid-June 2014) and 45 (late November 2014). The greatest differences in daily PA for subjects 1-8 occurred at lags 10 (late March 2014), 38 (early October 2014), and 49 (mid-December 2014) and corresponded with the changing temperature in a non-linear manner. That is, daily PA generally corresponded with the transition in temperature/season overall, but peak activity did not correspond with peak temperature, indicating that activity levels were highest during periods of warm, but not hot, temperatures. However, for subjects 9-16 (Fig. 3), the greatest differences in daily PA (lag 18/early June 2015) corresponded with the greatest seasonal temperature difference (lag 22/early July 2015) and did not coincide with the seasonal transition/change in temperature as it did for subjects 1-8.
Fig. 2 -.
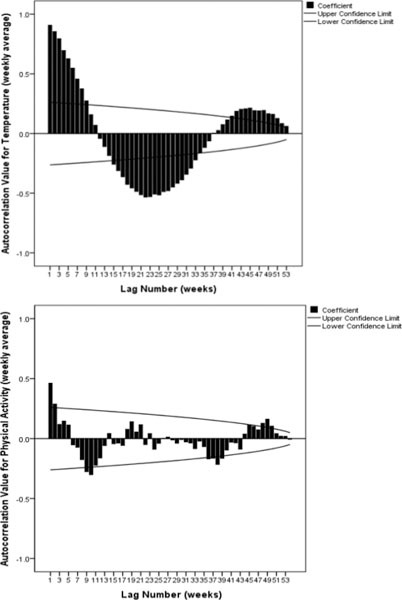
Autocorrelation plots of temperature (upper panel) and daily physical activity (lower panel) for subjects 1-8.
Fig. 3 -.
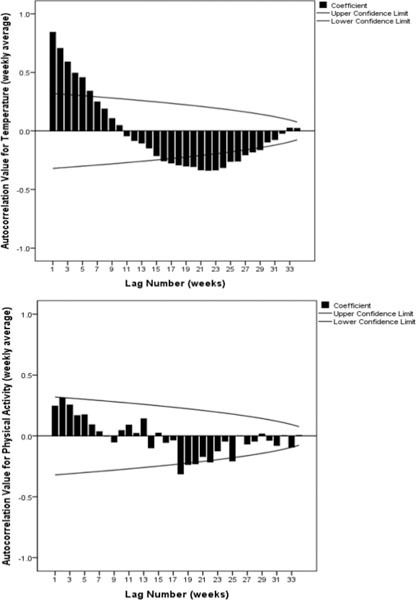
Autocorrelation plots of temperature (upper panel) and daily physical activity (lower panel) for subjects 9-16.
The seasonal subseries plots for weekly and monthly averages of daily PA (Fig. 4) clearly depict differences in activity levels across the observed time periods. The greatest differences in activity level for subjects 1-8 occurred between January 2014 and October 2014, and between February 2015 and July 2015 for subjects 9-16. Quantitative analysis using Wilcoxon signed-rank testing revealed median differences of 0.30 hours for subjects 1-8 (p = 0.050) and 0.36 (p = 0.036) hours for subjects 9-16, with effect sizes of 0.69 and 0.74, respectively. When combining all subjects for the “low” and “high” activity months, the median differences were 0.39 hours (p = 0.004), with an effect size of 0.71 (Fig. 5). Percent change between these time frames for each subject grouping (1-2-3-4-5-6-7-8, 9-10-11-12-13-14-15-16), as well as the entire group (subjects 1-16) was 13.78%, 20.69%, and 19.70%, respectively.
Fig. 4 -.
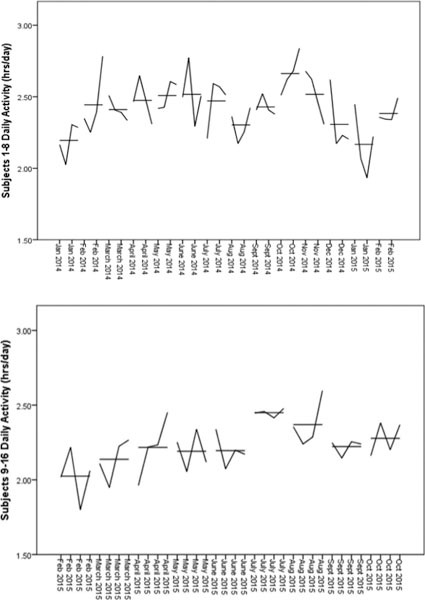
Seasonal subseries plots (upper panel subjects 1-8, lower panel subjects 9-16).
Fig. 5 -.
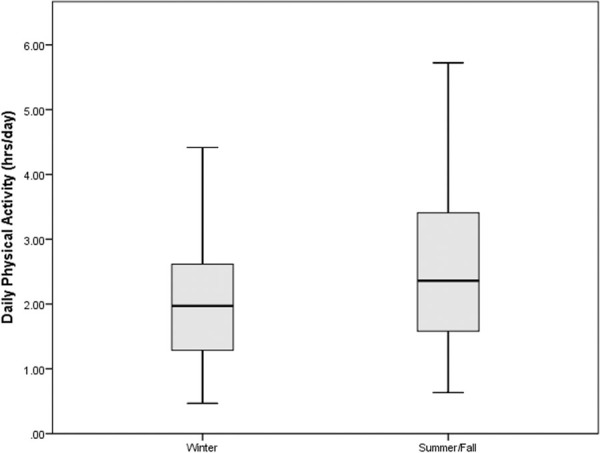
Difference in daily physical activity between seasons (subjects 1-16).
Discussion
Previous research in non-HF subjects have generally indicated that there may be seasonal-related changes in daily PA. The purpose of the present study was to determine if there was a seasonal change in daily PA in community-dwelling individuals with HF who also had ICD/CRT devices. The longitudinal daily PA information stored by ICD/CRT devices in the two small samples of subjects across the two time periods examined in the present study provided a unique opportunity to examine longitudinal daily PA data against weather data for the same time period. Our hypothesis was rejected with results demonstrating seasonality in daily PA that reflect some of the various and conflicting findings previously noted in other population samples.
The magnitude of seasonal variation between summer/fall and winter in the present study ranged from 13.78% to 20.69%. This variation is greater than that found by Sumukadas et al (13) who observed a difference of 3.99% between June and February in elderly people with self-reported limitations in daily PA in the UK, and is also greater than the 10% or less observed by Tudor-Locke et al in the southeastern USA (16). The present results are more similar to Witham et al (9) who found a 16.5% difference in activity counts between the longest day and the shortest day of the year in Scotland. Although not investigated for within-subject differences, self-reported daily PA in Canada revealed that 64% of Canadians were inactive in the winter compared to 49% in the summer, a difference of 16% (12).
Another finding of previous research that is reflected in the present study is the association between daily PA and temperature. There is conflicting research as to whether the relationship is linear, or if there is a cut point in which daily PA either decreases or plateaus at a certain temperature. Chan et al (10) found that for every 10°C rise in temperature, there was a corresponding 2.9% increase in steps per day with no plateau. This corresponds to findings by Klenk et al (7) who found that for every 10°C rise in temperature walking time increased by seven minutes, with no apparent plateau. Subjects 9-16 in the present study demonstrated an increase of 0.5 hours (20.69% increase) of activity per day across a rise of 23°C, and peak activity levels corresponded with peak temperature.
In contrast, subjects 1-8 demonstrated peak activity levels during seasonal transitions when temperatures were moderate (approximately 5-15°C), and appeared to plateau when temperatures rose beyond 15°C. This finding is consistent with that of Togo et al (8) who found a rise in daily PA from -2°C to 17°C followed by a decline in daily PA from 17-29°C. Although no statistically significant decline was noted in the present subjects, there was a trend in that direction (lag 18 in bottom panel, Fig. 2). Other studies also observed a plateau in activity with increasing temperatures, although the temperature at which the plateau occurred was much higher (22.5°C (6) and 30°C (7)).
Seasonal variation in daily PA of 0.3 hours and 0.36 hours, such as that found in this study, could potentially affect results of research studies evaluating changes in daily PA. Future research studies should consider accounting for this variation in physical activity by either controlling for the season in which data collection occurs or by considering adjustment of daily PA values based on the season in which a baseline and follow-up measurement occurs. Similarly, clinical interpretation of changes in daily activity should also consider seasonality. However, additional research in larger samples is needed to replicate and definitively determine the presence and magnitude of seasonal changes in daily PA. Additionally, research in other countries and other populations has examined the immediate and short-term effects of various weather parameters on daily PA including wind speed (6, 8, 13), maximum wind speed (11), minimum temperature (10), maximum temperature (8, 10), average temperature (6, 7, 11), day length (8, 10, 13), sunshine duration (6, 10) ozone (6), atmosphere (6), global radiation (8), precipitation (8, 10, 14), total rainfall (11), total snowfall (11),daily humidity (8). Future studies should also evaluate the potential effect of these variables on daily PA in the USA and in patients with HF, as no prior study has comprehensively considered the effect of these weather variables in this population.
The present study has several important limitations, first of which is the small sample size. This prohibits generalizability, and because it included only individuals with ICD/CRT devices, it also limits generalizability to the general HF population. A second limitation is that a portion the intervention period was included in the data set for some subjects who were in one of the intervention groups. However, there was a clinically meaningful intervention effect in only one subject, and the affected data points were imputed using baseline values. A third limitation was the lack of the availability of data for all 16 subjects across a single, long time frame resulting in analysis of two subgroups/time frames. However, this provided a hypothesis-generating opportunity for future work as the differing results in each subgroup were reflective of the conflicting findings that exist in the literature. Lastly, the effect of temperature on this sample could be tempered by the very low daily PA associated with their chronic disease. This group of individuals may spend more of their time indoors, and temperature may not be as influential on their daily PA levels as more active individuals.
Conclusion
Findings of the present study indicate that seasonal variation in temperature affects daily PA in individuals with HF. This seasonal variation may need to be accounted for in future research studies investigating daily PA and when clinically interpreting changes in daily PA over time.
Acknowledgement
The authors thank the Spectrum Health Heart and Lung Specialized Care Clinic and the Spectrum Health Cardiac Device Clinic.
Disclosures
Financial support: This study was funded by the Medtronic Cardiac Rhythm and Heart Failure External Research Program. All decisions related to study design, data collection, analysis, interpretation, and manuscript preparation were that of the authors. Medtronic review of the manuscript was strictly related to accurate representation/description of Medtronic products.
Conflict of interest: The authors have no conflicts of interest.
References
- 1.Shoemaker MJ, Curtis A, Vangsnes E, Dickinson MG, Paul R. Analysis of daily activity from implanted cardiac defibrillators: the minimum clinically important difference and relationship to mortality/life expectancy. World J Cardiovasc Dis. 2012;2(3):129–135. [Google Scholar]
- 2.Howell J. Maximum daily 6 minutes of activity: an index of functional capacity derived from actigraphy and its application to older adults with heart failure. J Am Geriatr Soc. 2010;58(5):931–936. doi: 10.1111/j.1532-5415.2010.02805.x. [DOI] [PMC free article] [PubMed] [Google Scholar]
- 3.Walsh JT, Charlesworth A, Andrews R, Hawkins M, Cowley AJ. Relation of daily activity levels in patients with chronic heart failure to long-term prognosis. Am J Cardiol. 1997;79(10):1364–1369. doi: 10.1016/s0002-9149(97)00141-0. [DOI] [PubMed] [Google Scholar]
- 4.Shoemaker MJ, Keenoy B, Smith B, Slotman P. Interventions to improve daily activity in individuals with COPD and CHF: A systematic review. World Journal of Cardiovascular Diseases. 2013;3:275–286. [Google Scholar]
- 5.Alahmari AD, Mackay AJ, Patel ARC et al. Influence of weather and atmospheric pollution on physical activity in patients with COPD. Respir Res. 2015;16(1):71–80. doi: 10.1186/s12931-015-0229-z. [DOI] [PMC free article] [PubMed] [Google Scholar]
- 6.Brandon CA, Gill DP, Speechley M, Gilliland J, Jones GR. Physical activity levels of older community dwelling adults are influenced by summer weather variables. Appl Physiol Nutr Metab. 2009;34:182–190. doi: 10.1139/H09-004. [DOI] [PubMed] [Google Scholar]
- 7.Klenk J, Büchele G, Rapp K, Franke S, Peter R. ActiFE Study Group. Walking on sunshine: effect of weather conditions on physical activity in older people. J Epidemiol Community Health. 2012;66:474–476. doi: 10.1136/jech.2010.128090. [DOI] [PubMed] [Google Scholar]
- 8.Togo F, Watanabe E, Park H, Shephard RJ, Aoyagi Y. Meteorology and the physical activity of the elderly: the Nakanojo study. Int J Biometeorol. 2005;50:83–89. doi: 10.1007/s00484-005-0277-z. [DOI] [PubMed] [Google Scholar]
- 9.Witham MD, Donnan PT, Vadiveloo T et al. Association of day length and weather conditions with physical activity levels in older community dwelling people. PLoS ONE. 2014;9(1):e85331. doi: 10.1371/journal.pone.0085331. [DOI] [PMC free article] [PubMed] [Google Scholar]
- 10.Chan CB, Ryan DAJ, Tudor-Locke C. Relationship between objective measures of physical activity and weather: a longitudinal study. Int J Behav Nutr Phys Act. 2006;3:21. doi: 10.1186/1479-5868-3-21. [DOI] [PMC free article] [PubMed] [Google Scholar]
- 11.Hagströmer M, Rizzo NS, Sjöström M. Associations of season and region on objectively assessed physical activity and sedentary behaviour. J Sport Sci. 2014;32(7):629–634. doi: 10.1080/02640414.2013.844349. [DOI] [PubMed] [Google Scholar]
- 12.Merchant AT, Dehghan M, Akhtar-Danesh N. Seasonal variation in leisuretime physical activity among Canadians. Can J Public Health. 2007;98(3):203–208. doi: 10.1007/BF03403713. [DOI] [PMC free article] [PubMed] [Google Scholar]
- 13.Sumukadas D, Witham M, Struthers A, McMurdo M. Day length and weather conditions profoundly affect physical activity levels in older functionally impaired people. J Epidemiol Community Health. 2009;63(4):305–309. doi: 10.1136/jech.2008.080838. [DOI] [PubMed] [Google Scholar]
- 14.Strath SJ, Kaminsky LA, Ainsworth BE, Ekelund U, Freedson PS, Swarts AM. Guide to the assessment of physical activity: clinical and research applications. A scientific statement from the American Heart Association. Circulation. 2013;128:2259–2279. doi: 10.1161/01.cir.0000435708.67487.da. [DOI] [PubMed] [Google Scholar]
- 15.Berstralh EJ, Mehrsheed S, Offord KP, Wahner HW, Melton III LJ. Effect of season on physical activity score, back extensor muscle strength, and lumbar bone mineral density. J Bone Miner Res. 1990;5(4):371–377. doi: 10.1002/jbmr.5650050410. [DOI] [PubMed] [Google Scholar]
- 16.Tudor-Locke C, Bassett Jr DR, Swarts AM et al. A preliminary study of one-year of pedometer self-monitoring. Ann Behav Med. 2004;28(3):158–162. doi: 10.1207/s15324796abm2803_3. [DOI] [PubMed] [Google Scholar]
- 17.NIST/SEMATECH e-handbook of statistical methods. Available from: http://www.itl.nist.gov/div898/handbook/eda/section3/boxplot.htm . Accessed August 1, 2016. [Google Scholar]
- 18.NIST/SEMATECH e-handbook of statistical methods. Available from: http://www.itl.nist.gov/div898/handbook/eda/section3/autocopl.htm . Accessed August 1, 2016. [Google Scholar]
- 19.NIST/SEMATECH e-handbook of statistical methods. Available from: http://www.itl.nist.gov/div898/handbook/pmc/section4/pmc4431.htm . Accessed August 1, 2016. [Google Scholar]
- 20.Portney LG, Watkins MP. Foundations of clinical research applications to practice 3rd ed. Upper Saddle River, NJ: Pearson Education, Inc; Nonparametric tests for group comparison. In: Portney LG, Watkins MP, eds. 2009. [Google Scholar]
- 21.Rosenthal R. In: Cooper H, Hedges LV, eds. The handbook of research synthesis. New York: Russell Sage Foundation; Parametric measures of effect size. 1994. [Google Scholar]