Figure 4.

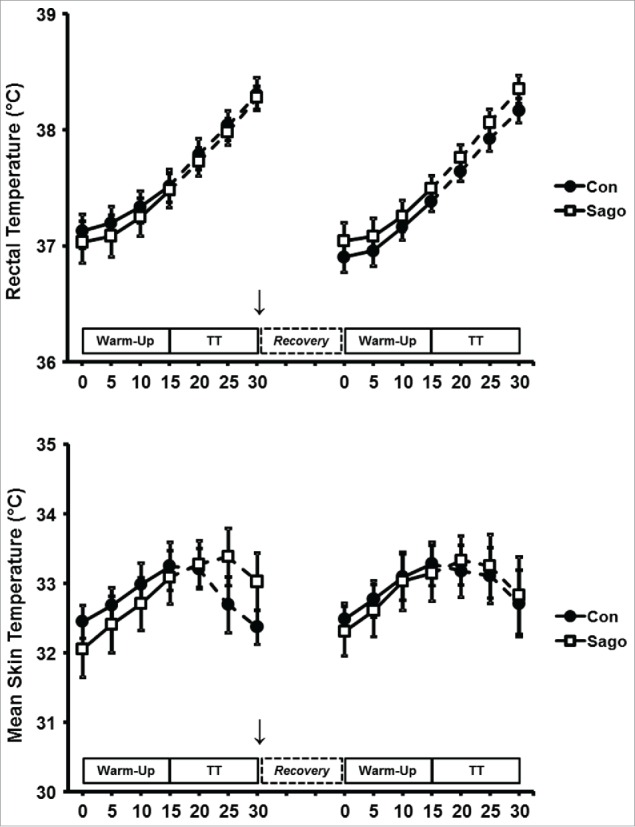
Rectal and mean skin temperatures during Exercise 1 and 2 for Control and Sago trials. TT: 15-min time-trial. Arrow indicates Sago ingestion. Data are expressed as mean ± SE.

Rectal and mean skin temperatures during Exercise 1 and 2 for Control and Sago trials. TT: 15-min time-trial. Arrow indicates Sago ingestion. Data are expressed as mean ± SE.