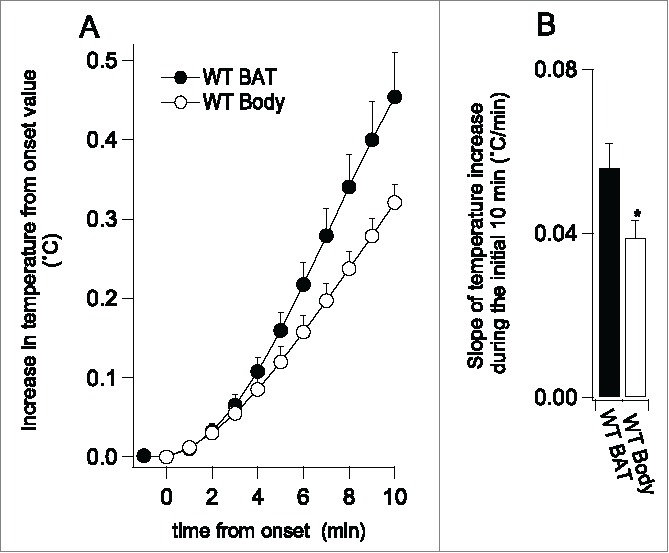
Figure 3.

(A) showed average (means±SE) of BAT and body temperature records (normalized to commence at zero) for the initial 10 min after the onset of an increase in temperature elicited by the cold exposure. (B) showed slopes of the increase in the initial 10 min (the black bar for BAT, the white bar for body, n = 12). *P < 0.05 compared with BAT.
