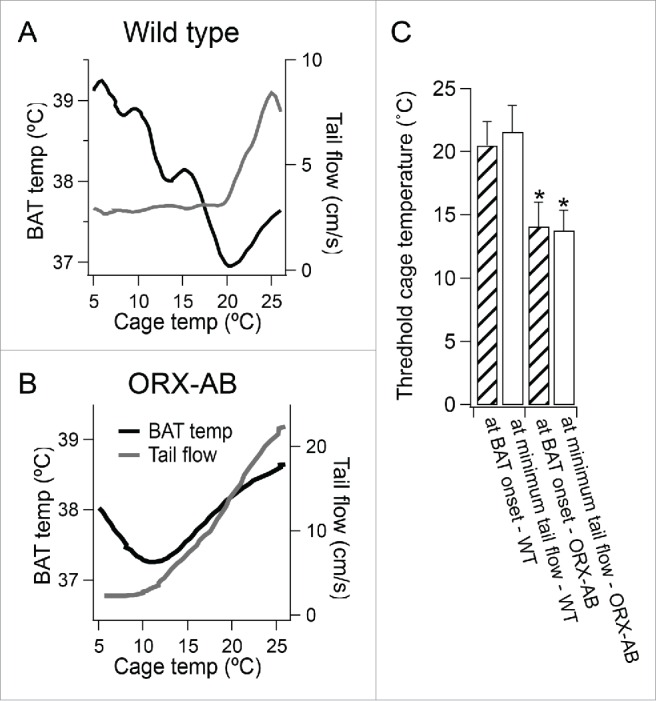
Figure 4.

(A and B) showed changes in BAT temperature and tail flow plotted against changes in experimental cage temperature for the corresponding traces in the Figure 1. (C) showed cage temperatures at the onset of increase in BAT temperature (at BAT onset, n = 10 for WT and ORX-AB rats) (checked bars) or at time when tail flow reached the minimum level (at minimum tail flow, n = 5 for WT and n = 8 for ORX-AB) (open bars) from WT and from ORX-AB rats. *P < 0.05 compared with WT.
