
Figure 1.
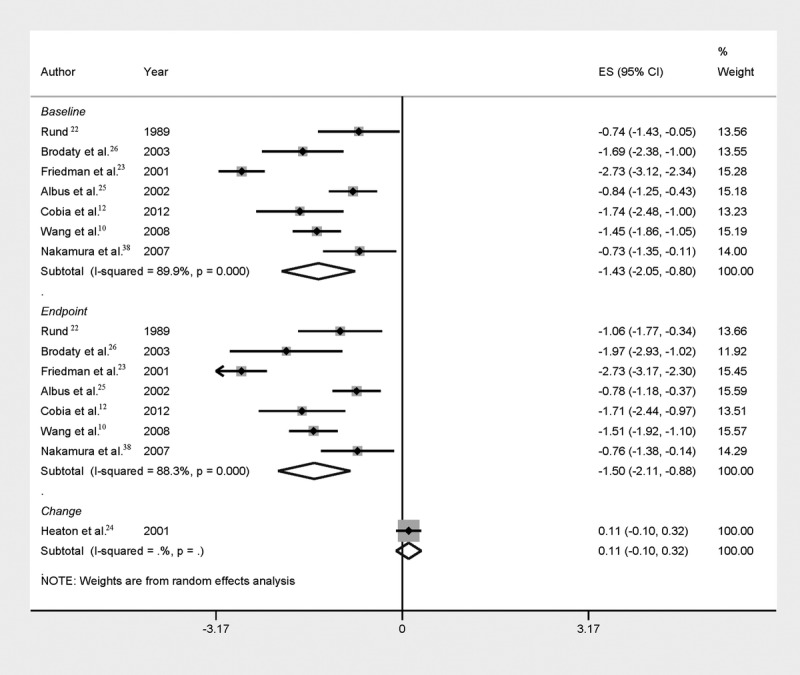
Forest plot of mean global cognitive impairment at the different time points (baseline and endpoint) of SZ patients versus healthy controls. For one study,24 change scores are reported. See Supplemental Table 4, http://links.lww.com/HRP/A36, for sample sizes.