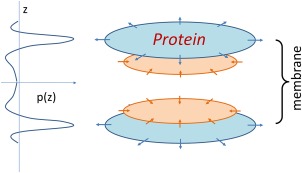
Figure 1.

Schematic diagram of pressure profile and tension distribution. The lateral pressure (p) as a function of position z along the membrane normal is presented on the left side. Tension forces applied on the embedded membrane protein is schematically presented on the right side. Sections near the aqueous‐membrane interface are in cyan, and sections buried inside the membrane are shown in orange.
