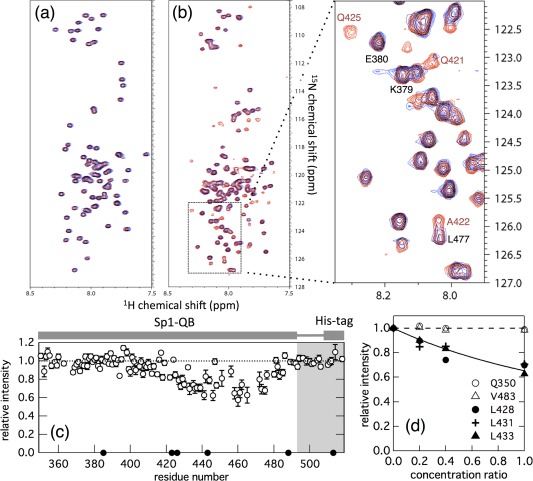
Figure 3.

(A) Overlay of the 1H‐15N HSQC spectra of 15N‐labeled Sp1‐QA in the absence (red) and presence (blue) of a three molar excess amount of unlabeled TAF4N/C measured at 4°C. The concentrations of 15N‐ Sp1‐QA in both spectra were 50 μM, and 150 μM unlabeled TAF4N/C was added. The peaks colored black indicate that both chemical shifts and the intensities of the peaks were not changed. (B) Overlay of the 1H‐15N HSQC spectra of 15N‐Sp1‐QB domains in the absence (red) and presence (blue) of an equimolar amount of unlabeled TAF4N/C measured at 4°C. Concentrations of 15N‐Sp1‐QB in both spectra were 50 μM and the same amount of unlabeled TAF4N/C was added. The region indicated by the dashed box in the spectrum is expanded in the right panel. The intensities of several peaks of 15N‐Sp1‐QB markedly decreased with the addition of unlabeled TAF4N/C. (C) The relative peak intensity of 1H‐15N HSQC spectra plotted against the residue number of Sp1‐QB. Intensity in the presence of the same concentration of unlabeled TAF4N/C relative to that in its absence is shown. The closed circle shows residues that could not be analyzed due to signal overlap. (D) Changes in the relative peak intensities of several representative residues in 15N‐Sp1‐QB in the presence of various concentrations (10, 20, and 50 μM) of unlabeled TAF4. Peak intensity in the presence of unlabeled TAF4N/C relative to its absence was plotted against the concentration ratio of TAF4N/C relative to that of 15N‐Sp1‐QB. Open and closed symbols represent residues with intensities that showed little or strong dependency on the concentration of TAF4N/C added, respectively. The solid line indicates the fraction of monomeric Sp1‐QB calculated on the assumption of a 1:1 binding model [Eq. (1)] at the binding constant K a = 4.0 × 10³ M−1.
