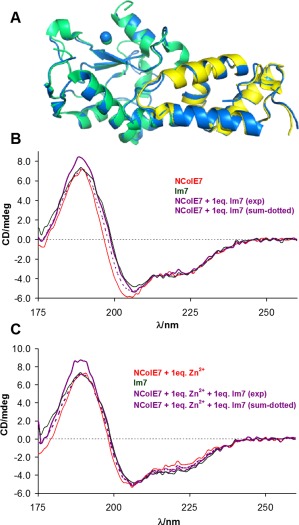
Figure 2.

Consequences of NColE7–Im7 interaction. (A) The comparison of the structures of free and bound Im7 and NColE7 proteins visualized from their single crystal structures. The free NColE7 structure (green, 1M08 15), as well as the free Im7 structure (yellow, 1CEI 27) is superimposed to the structure of the NColE7‐Im7 complex (blue, 7CEI 28). The Zn2+‐ions are indicated by spheres. (B) The experimental SRCD spectra of NColE7 and Im7 proteins (3.2 × 10⁻⁵ M) and their equimolar mixtures (1.6 × 10⁻⁵ M, each). The mathematical sum of the component protein spectra considering the same composition as in the experiment, but assuming no interaction between the two proteins is also shown for comparison. (C) The same as (B) but the spectra were recorded in the presence of an equivalent amount of Zn2+‐ions referred to the actual NColE7 concentration.
