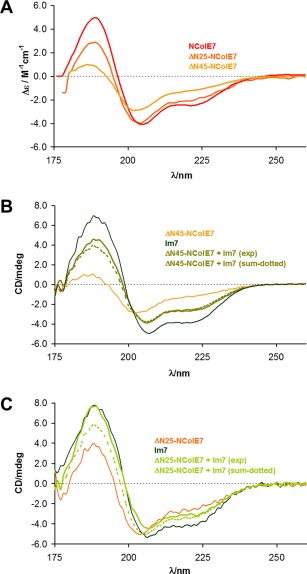
Figure 6.

SRCD spectra of the N‐terminally truncated NColE7 mutants. (A) Comparison of the molar SRCD spectra of the ΔN25, ΔN45‐NColE7 truncated mutant proteins and that of the native NColE7. The calculation of the Δε values was based on the average amino acid residue molecular weight for each protein. (B) Experimental spectra of Im7 protein and the ΔN45‐NColE7 mutant (3.2 × 10⁻⁵ M, each) and their equimolar mixtures (1.6 × 10⁻⁵ M, each). The calculated spectra constructed from the component spectra are also shown for comparison. (C) Comparison of the experimental spectra of Im7 and the ΔN25‐NColE7 mutant proteins (3.2 × 10⁻⁵ M, each) and their equimolar mixtures (1.6 × 10⁻⁵ M, each). The calculated spectra constructed from the component spectra are also shown.
