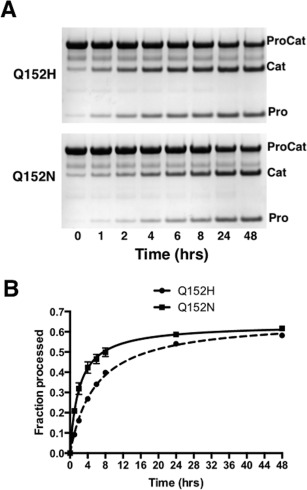
Figure 2.

Autoproteolysis of the ProCat mutants. (A) An example of SDS‐PAGE gels of a time course analysis of the proteolysis of ProCat(Q152H) (Top) and ProCat(Q152N) (bottom) over 48 hrs. “ProCat”, “Cat”, and “Pro” indicate the unprocessed ProCat, the catalytic domain, and the prodomain, respectively. (B) A graphical representation of this data with a plot of the fraction of ProCat(Q152H) (Squares, solid line) and ProCat(Q152N) (circles, dashed line) processed versus time.
