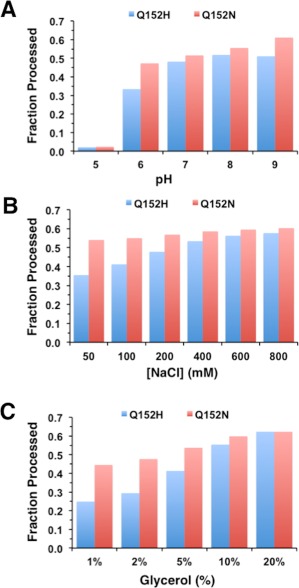
Figure 4.

Effect of solution conditions on autoproteolysis of the ProCat mutants. The plots shows the amount of ProCat(Q152H)(blue columns) and ProCat(Q152N) (red columns) processing that occurred after a 24 hour time period for solution conditions that varied in (A) pH, (B) NaCl concentration, and (C) glycerol concentration.
