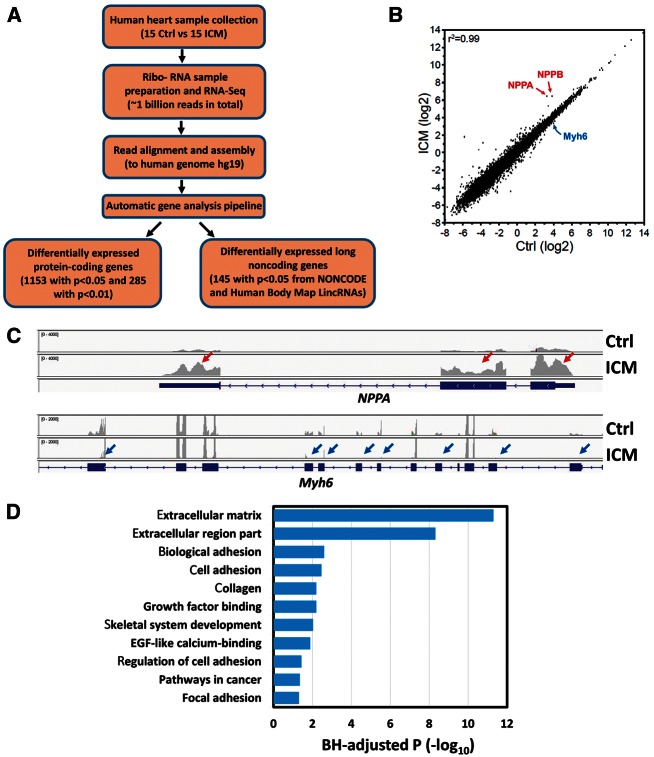
Figure 1.
RNA-Seq analyses of gene expression in control and ICM human heart samples. (A) Workflow of RNA-Seq and data analysis; (B) Scatter plot of the expression of protein-coding genes between control and ICM samples indicates that the overall transcriptome for protein-coding genes is similar between control and ICM hearts (R2 =0.99); (C) Comparison of total reads from control and ICM hearts for NPPA and Myh6 loci. The RNA-Seq reads were plotted and visualized with IGV browser. Red and blue arrows indicate up- or down-regulated expression of exons, respectively, in ICM. (D) Gene ontology analysis of 1051 up-regulated protein-coding genes (P<0.05) in ICM samples. The GO terms are ranked by the Benjamini–Hochberg (BH)-adjusted P-value.

