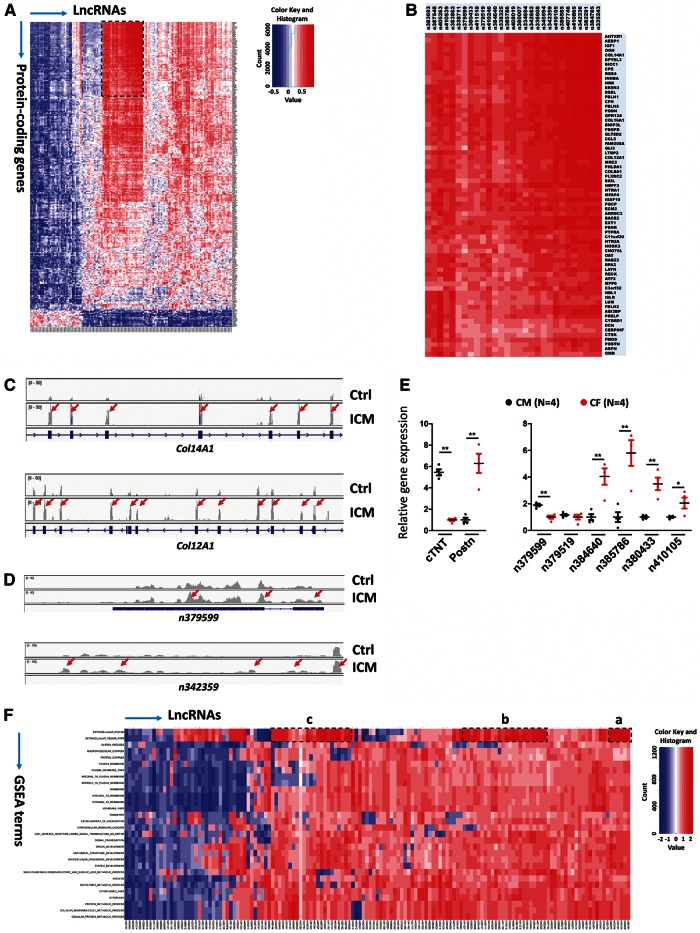
Figure 4.
The expression of lncRNAs is associated with ECM gene expression in ICM. (A) Association matrix of 145 differentially expressed lncRNAs and 285 differentially expressed protein-coding genes. Positive (red) and negative (blue) expression correlations are shown. Clustered lncRNAs and 69 protein-coding genes are boxed and shown in (B). (C, D) Comparison of total reads from control and ICM hearts for protein-coding gene loci Col14A1 and Col12A1 and lncRNA gene loci n379599 and n342359, respectively. RNA-Seq reads were plotted and visualized with IGV browser. Red arrows indicate up-regulated exons in ICM samples. (E) qRT-PCR analysis of the expression of mouse lncRNAs in adult mouse CM and CF. Cardiac troponin T (cTNT) or periostin (Postn) marks CM and CF, respectively (left panel). N number for each group is indicated.*P <0.05; **P <0.01. (F) Association matrix of 145 differential expressed lncRNAs and 30 functional gene sets based on GSEA. Positive (red) and negative (blue) expression correlations are shown. Three clusters with positive expression correlation are boxed and labelled as a–c.

