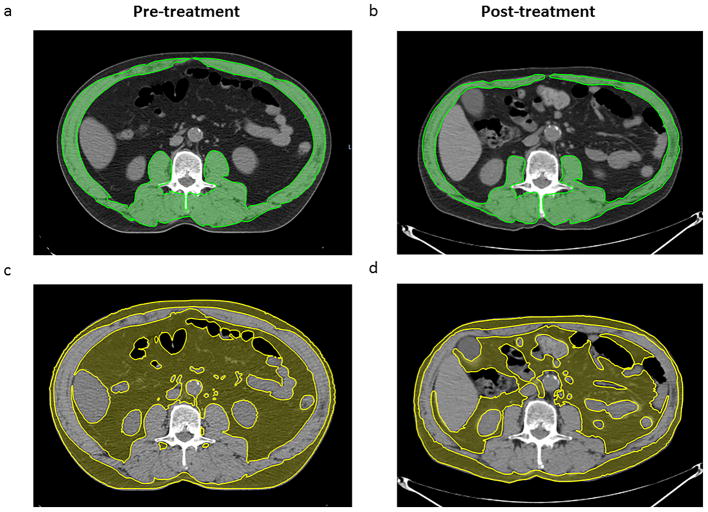
Figure 1.
Pre- and post-treatment axial Computed Tomography (CT) image at the level of the third lumbar vertebra. The upper panel (a,b) shows the skeletal muscle mass highlighted in green (−29 to 150 Hounsfield units) while the lower panel (c,d) shows the adipose tissue mass highlighted in yellow (−190 to −30 Hounsfield units)

