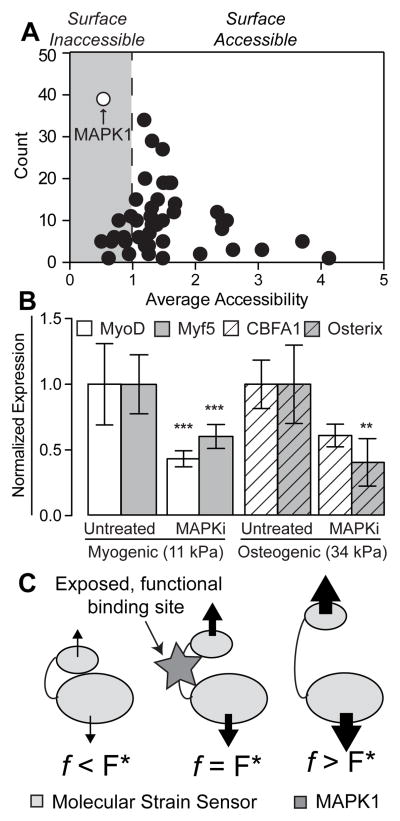
Figure 1. ScanSite Results for 47 Different Focal Adhesion Proteins.
(A) Each data point represents a predicted binding partner. The y-axis displays the number of times this binding partner was identified during the analysis of the 47 focal adhesion proteins, while the x-axis shows the average accessibility of the binding site. Predicted surface inaccessible binding sites have accessibility values below 1 (gray region). (B) MAPK1 inhibitor pyrazolylpyrrole (MAPKi) was applied to cells at the beginning of the 4-day time course on both (A) 11 kPA and (B) 34 kPa substrates and stained for (A) MyoD (white) or Myf5 (gray) and (B) CBFA1 (white barred) or Osterix (gray barred) as indicated on day 4. Mean nuclear fluorescence is plotted normalized to untreated cells. **p<0.01 and ***p<0.001 relative to untreated cells stained for the same transcription factor. (C) Schematic of force-induced conformational changes by a “molecular strain sensor” where proteins bound to the sensor stretch the it by transmitting a force across the protein. The resulting conformational change exposes the once cryptic binding site at an optimal force, F* (middle schematic). Above or below that value results in excessive deformation of the binding site to prevent binding or not enough stretch causing the site to remain cryptic, respectively.

