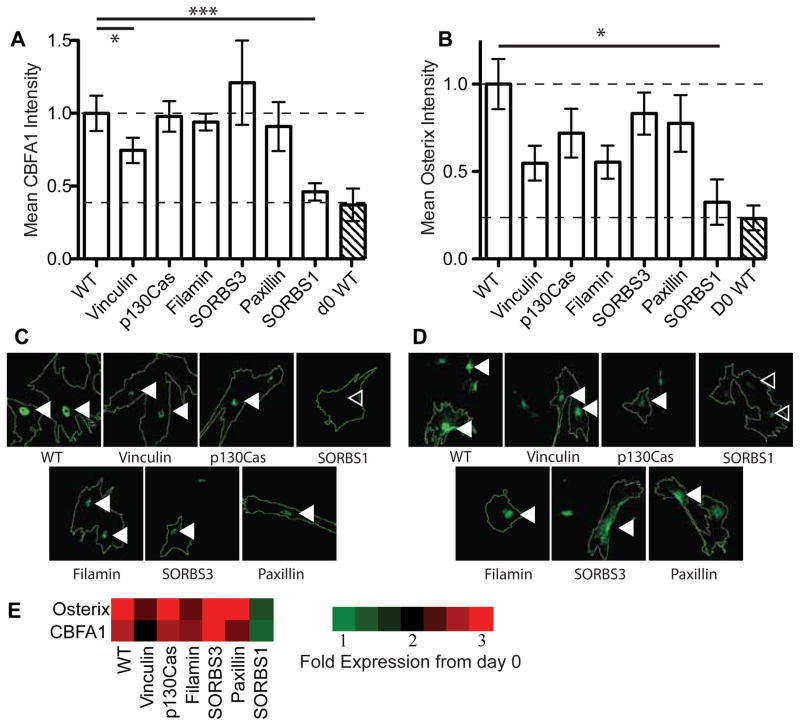
Figure 3. Osteogenic Differentiation and Focal Adhesion Protein Knockdown.
Normalized mean intensity levels of (A) CBFA1 and (B) Osterix immunofluorescence staining after four days of culture of osteogenically favorable 42 kPa substrates. Representative images show cell outlines along with (C) CBFA1 and (D) Osterix expression. Filled arrowheads indicate nuclei that maintained transcription factor expression whereas open arrowheads indicate nuclei that lost expression. (E) Heat map indicating fold-change in expression of the indicated osteogenic markers from day 0 wild type cells. For WT, Vinculin, p130Cas, Filamin, SORBS3, Paxillin, SORBS1, and d0 WT in (A) and (B), n=298, 35, 28, 44, 29, 28, 20, and 40, respectively.

