
Figure 4.6.
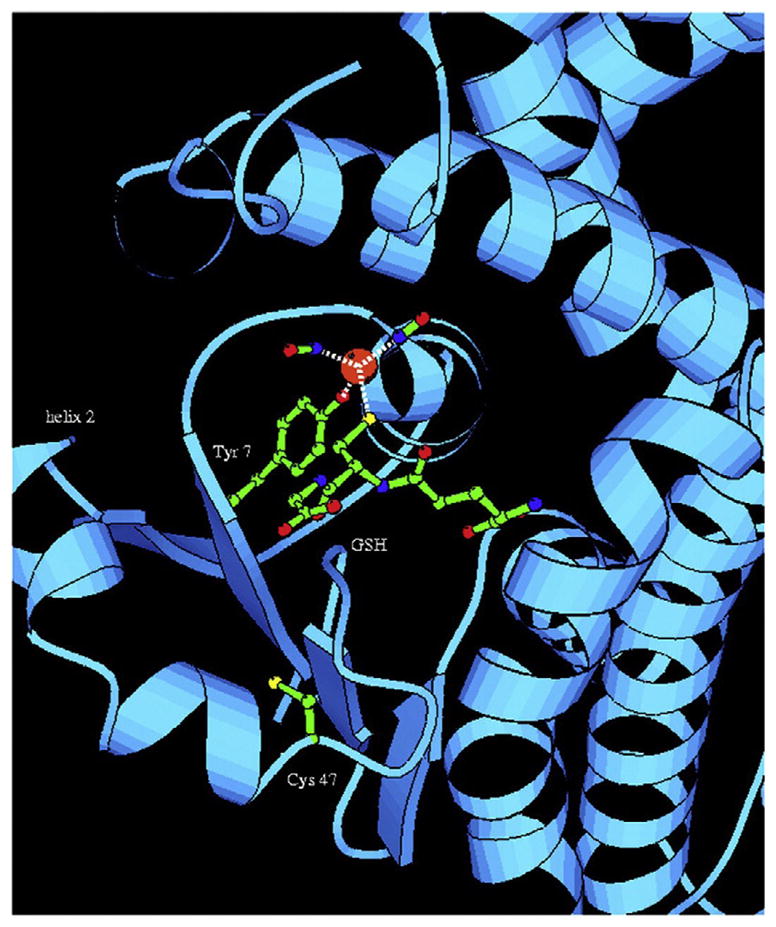
Ribbon depiction of the DNGIC/GSTP1-1 complex. The close-up view of the active site of the covalent DNGIC (as obtained after removal of the excess GSH) is shown. The model shows that (i) one of the GSH ligands of DNDGIC can dock into the G-site and adopt the canonical extended conformation seen in crystal structures of GST–GSH complexes, (ii) Tyr7 is close enough to displace the other GSH ligand to generate a stable enzyme-inhibitor complex, and (iii) the NO moieties of the complex form van der Waal’s interactions with Ile104 and Tyr108. In addition, there are possible polar interactions with Tyr108 and the main chain nitrogen of Gly205. The iron atom is depicted as an orange sphere, oxygen atoms are colored red, nitrogen atoms are blue, sulfur atoms are yellow, and carbon atoms are green. This figure was drawn using MOLSCRIPT. Reproduced from Lo Bello et al. (2001) with permission.