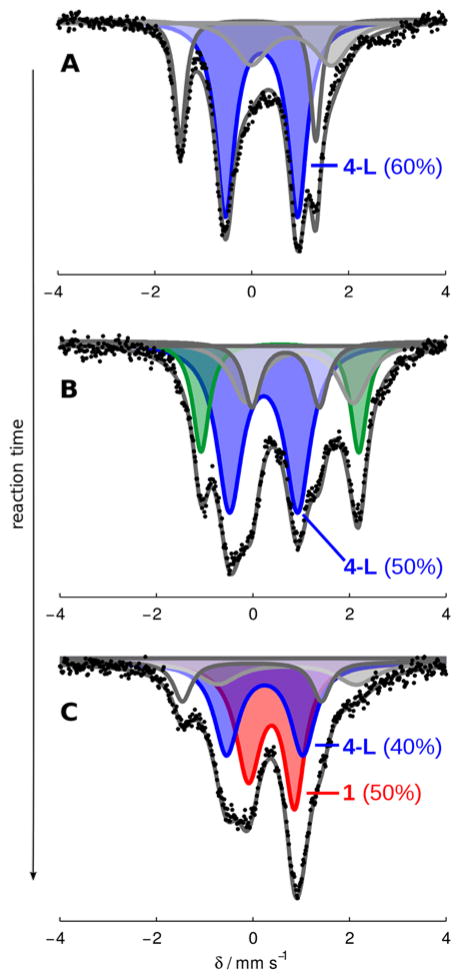
Figure 8.
Frozen solution Mössbauer spectra collected at 80 K in the presence of a 50 mT parallel magnetic field. (A) A catalytic mixture (Et2O, 0.43 mM 1, 150 equiv HBArF4, 185 equiv KC8) freeze-quenched after 5 minutes of stirring at −78 °C; (B) a catalytic mixture (Et2O, 0.43 mM 1, 150 equiv HBArF4, 185 equiv KC8) freeze-quenched after 10 minutes of stirring at −78 °C; (C) a catalytic mixture (Et2O, 0.43 mM 1, 150 equiv HBArF4, 185 equiv KC8) freeze-quenched after 25 minutes of stirring at −78 °C. Data presented as black points, simulations as solid grey lines with components plotted as solid areas underneath the curve. For parameters of individual components, see SI.

