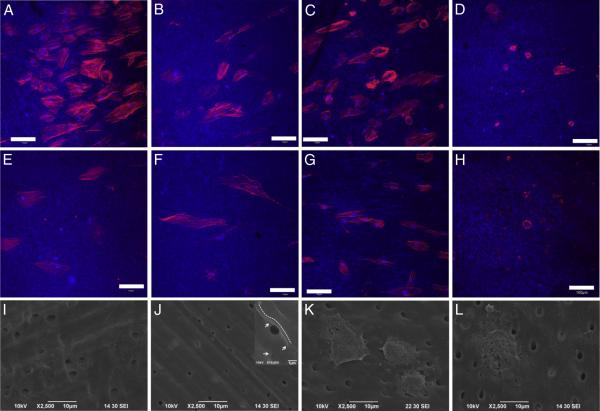
Figure 2.
DPSC adhesion and spreading on treated dentin on days 1, 3, and 7 after cell seeding. The images are maximum intensity projections of Z slices (depth ,~ 20 μm). Dentin was viewed using an excitation wavelength of 405 nm and is false-colored blue. Rhodamine phalloidin has excitation and emission (nm) at 540/565 nm, and the actin filaments appear as red (red: actin, blue: dentin, light blue: nucleus). Representative CLSM images showing cell adhesion on day 1 on dentin treated for 7 days (n = 4/group) with (A) saline (control), (B) antibiotic-free nanofibers, (C) triple antibiotic–containing nanofibers, and (D) TAP (1g capsule containing equal parts of ciprofloxacin, minocycline, and metronidazole in 1 mL PBS). CLSM images displaying cell adhesion on day 3 on (E) control, (F) antibiotic-free nanofibers, (G) triple antibiotic–containing nanofibers, and (H) TAP (bar = 100 μm). Representative scanning electron microscopic micrographs showing cell morphology (day 7) on dentin-treated specimens with (I) saline (control), (J) antibiotic-free nanofibers (inset [10,000× original magnification] clearly shows cells covering the dentin surface and dentinal tubules); please note the dotted white line revealing the cell’s contour and the white arrows pointing out the dentin substrate, (K) triple antibiotic–containing nanofibers, and (L) TAP.

