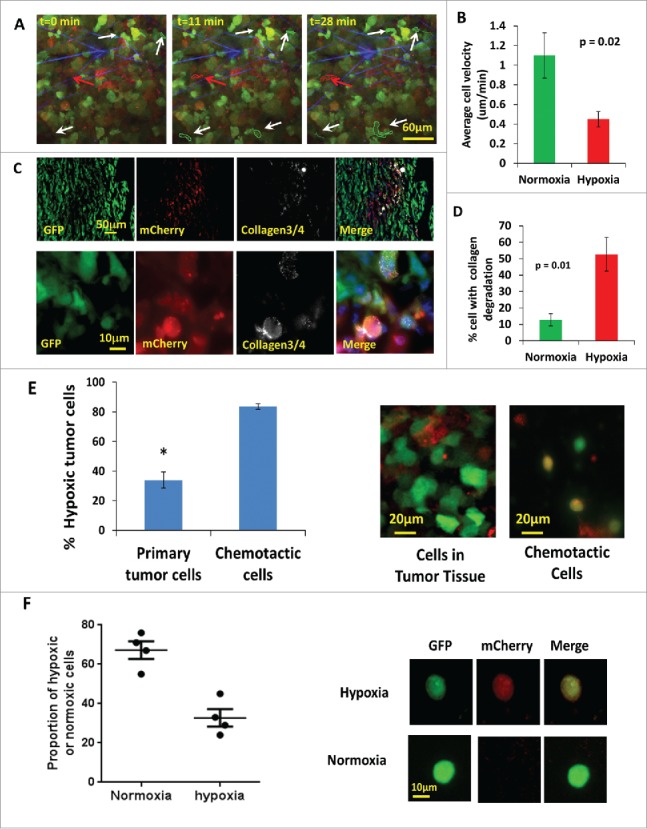
Figure 5.

Hypoxic tumor cells are enriched in the invasive and chemotactic tumor cell population in vivo. (A) Multiphoton microscopy images of GFP-MDA-MB-231-5HREODD-mCherry xenograft tumor cells at 0, 11 and 28 minutes. White arrows point to GFP-only normoxic cells. Red arrow points to a motile mCherry positive hypoxic cell. Each moving cell outline was traced. The green outlined cells are normoxic cells and the red outlined cell is a hypoxic cell. Green=GFP normoxic, Red=mCherry hypoxic, Blue=Second Harmonic Generation (SHG) from collagen. (B) Quantification of average cell velocity in vivo migration for hypoxic and normoxic cells. Fields of view containing hypoxic cells were analyzed for motion of either green normoxic and/or red hypoxic cells, n=28. P=0.02 (Student's t-test), error bars: mean±s.e.m. (C) Representative images of collagen ¾antibody staining on GFP MDA-MB-231 hypoxia reporter derived tumor tissue frozen sections showing overlap of collagen degradation with hypoxic tumor cells. The lower panel images are at higher magnification to have a better view of the collagen¾ antibody staining around single cells. Red=mCherry hypoxic, green=GFP normoxic, gray=collagen¾, blue=nuclei. (D) Quantification of the percent of cells with collagen degradation within the normoxic or hypoxic tumor cell populations. Each bar is the percentage of the respective cell type. The green bar is normalized to the number of total green cells while the red bar is normalized to the total number of hypoxic cells. Fields of view containing collagen degradation were analyzed. P value is by Student's t-test, error bars: mean±s.e.m., n=5. (E) Percentage of hypoxic cells in the population that migrated to HuEGF gradient (chemotactic cells) vs the percentage of hypoxic cells in primary tumor tissue where the needle was placed. Representative images are tumor cells in primary tumor tissue and chemotactic tumor cells collected using the in vivo invasion assay with 25 nM huEGF. Red=mCherry hypoxic, green=GFP normoxic. Error bar: SEM. * p<0.05 (Student's t-test), n=3 mice. (F) Analysis of circulating tumor cells. CTCs were imaged for mCherry and GFP signals. mCherry and GFP pixel intensity was normalized to the highest signal in each channel respectively among the CTCs. The ratio of the normalized mCherry to GFP signals in individual cells was calculated. Ratio of normalized mCherry to GFP below 0.5 = normoxia, above 0.5 = hypoxia. The percentage of hypoxic and normoxic cells were plotted. 4 mice were used. The representative images for hypoxic and normoxic cells are shown on the right.
