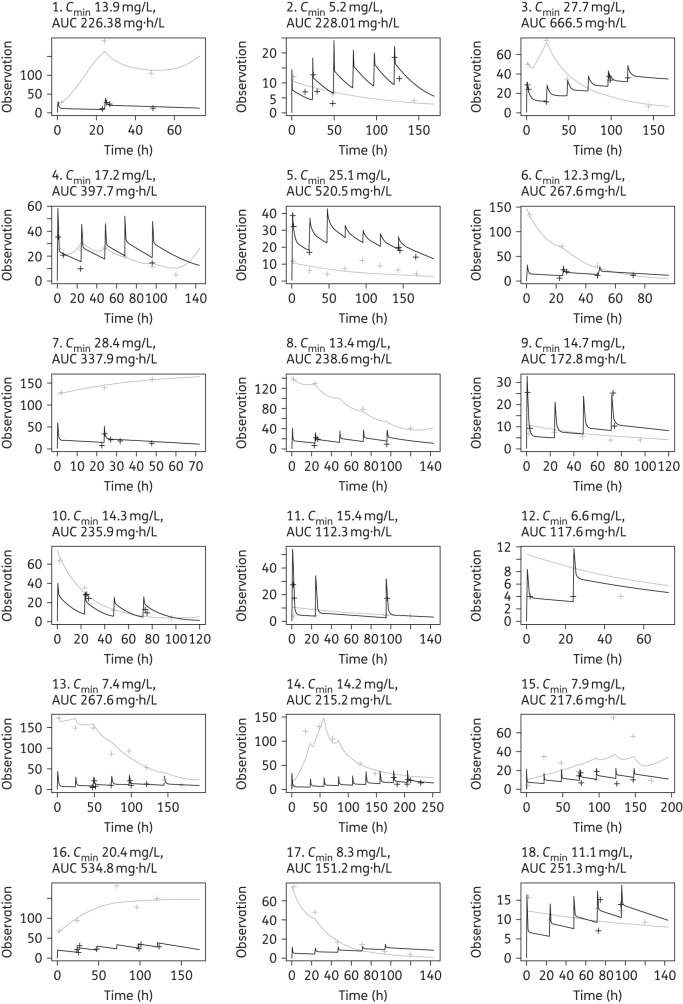
Figure 3.
Individual concentration–time plots after the Bayesian step showing teicoplanin (black) and CRP (grey) predicted (continuous line) and observed (crosses) concentrations over time for each of the patients. The y-axis ‘Observation’ refers to both teicoplanin and CRP concentrations. Individuals 1 and 7 were infected with Gram-negative bacteria and only received two doses of teicoplanin. The individual average Cmin and AUC drug exposures are reported for each patient.

