Figure 6.

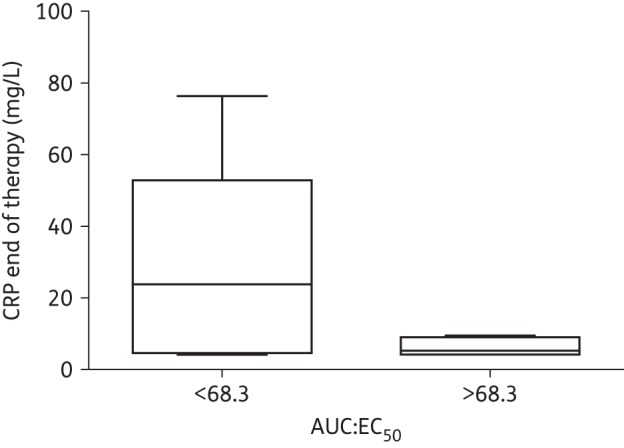
AUC:EC50 box-plot suggesting that patients attaining >68.3 drug exposures (∼>AUC 389.3 mg·h/L) had a more consistently lower CRP at the end of therapy (mean 18.18 versus 5.7 mg/L); P = 0.002 (two sample t-test).

AUC:EC50 box-plot suggesting that patients attaining >68.3 drug exposures (∼>AUC 389.3 mg·h/L) had a more consistently lower CRP at the end of therapy (mean 18.18 versus 5.7 mg/L); P = 0.002 (two sample t-test).