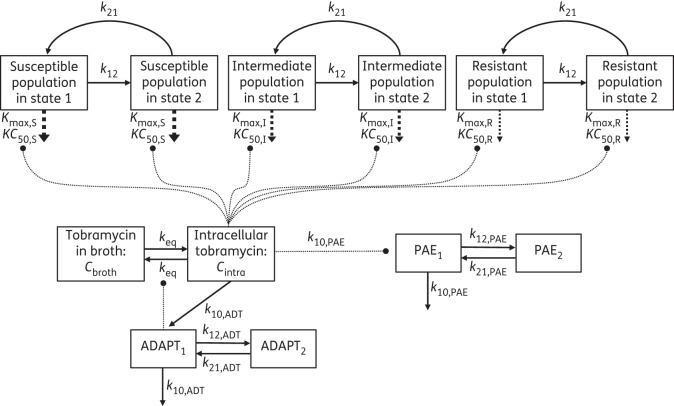
Figure 1.
Model diagram of the life cycle growth model including three populations, susceptible, intermediate and resistant, with two states each to describe bacterial replication. The maximum killing rate constants (Kmax) and the antibiotic concentrations (KC50) causing 50% of Kmax are explained in Table 2. The concentration of tobramycin in broth (Cbroth), intracellular tobramycin (Cintra), ADAPT1, ADAPT2 and all corresponding rate constants are described in the Materials and methods section.

