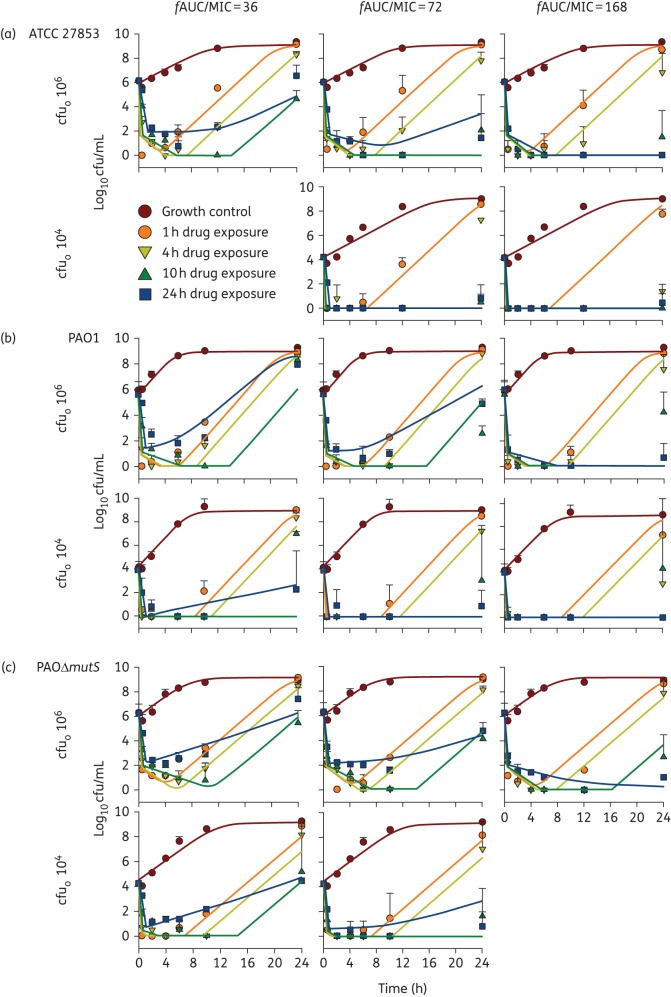
Figure 2.
Observed viable counts (mean ± SD) and population predicted profiles (continuous lines in corresponding colours) for P. aeruginosa ATCC 27853 (a), PAO1 (b) and PAOΔmutS (c) exposed to tobramycin at an fAUC/MIC of 36 (left column), 72 (middle column) and 168 (right column) delivered over 1, 4, 10 or 24 h durations of exposure, at initial inocula (cfuo) of 106 and 104 cfu/mL, excluding fAUC/MIC of 36 for ATCC 27853 and fAUC/MIC of 168 for PAOΔmutS for cfuo 104 cfu/mL. This figure appears in colour in the online version of JAC and in black and white in the print version of JAC.

