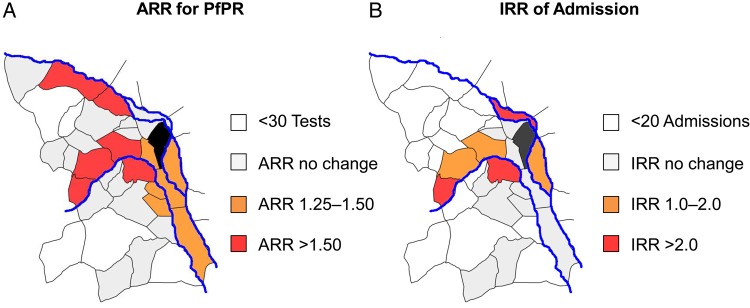
Figure 3.
Map demonstrating the relationships between river distribution and changes in malaria risk in the preflood versus postflood periods. A dose-response effect of flood and distance to major rivers can be seen, whereby the regions closest to rivers and at the highest altitudes had the greatest relative increase in positive malaria test results and malaria-related admissions following the flood. Villages without direct access to rivers and at lower elevations were generally less affected. Abbreviations: ARR, adjusted risk ratio; PfPR, Plasmodium falciparum test positivity rate.

