Figure 1.

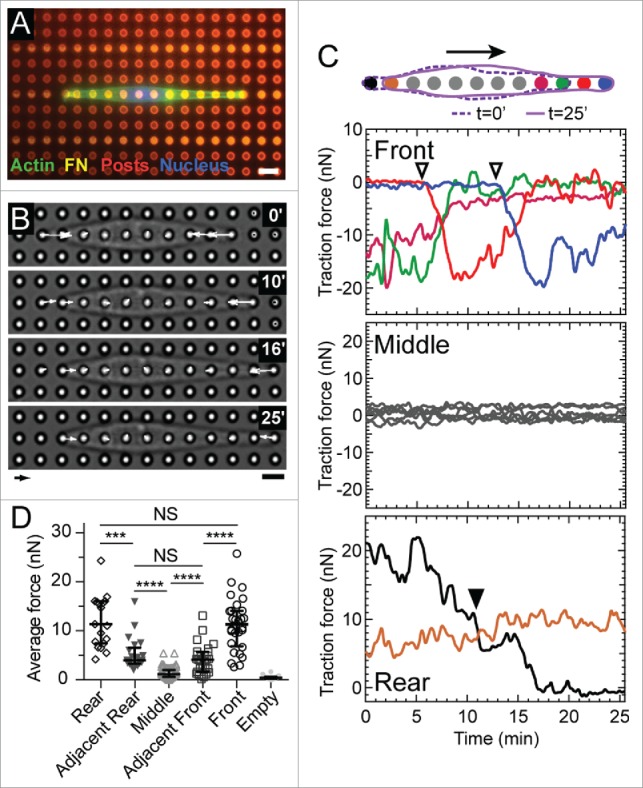
Cell migration on microposts in 1D. (A) Fluorescent image of a representative 3T3 cell stained for actin (green) and its nucleus (blue). The cell is confined to migrate along a row of microposts (red) that have been printed with a line-pattern of fibronectin (magenta). Scale bar: 6 μm. (B) Phase contrast images of a representative migrating cell and its corresponding traction forces. Arrow scale: 10 nN, bar scale: 6 μm. (C) Traces of traction forces over time at each micropost for the representative cell. The color of each trace is illustrated in the accompanying diagram. (Top) Forces at the front of the cell increased when a new adhesion was formed (open inverted triangles). As the force at the front of the cell increases, the force at the micropost adjacent to it decreases. (Middle) Forces at the middle of a cell had an average value of zero within a range of ±5 nN. (Bottom) Force at the rear of the cell decreased steadily over time and did not correlate with the forces at the leading edge. When the cell detached from a rear micropost (▾), the force at its adjacent micropost (brown) increased. (D) Average forces at microposts at the front, adjacent to the front, middle, adjacent to the rear, and rear of migrating cells (M = 15, N = 165 where M indicates the number of experiments and N is the total number of force measurements). The empty posts indicate the posts unoccupied by a cell, the forces of which thus indicate the force resolution of the micropost array. **** p < 0.0001, *** p < 0.001, NS: p > 0.05.
