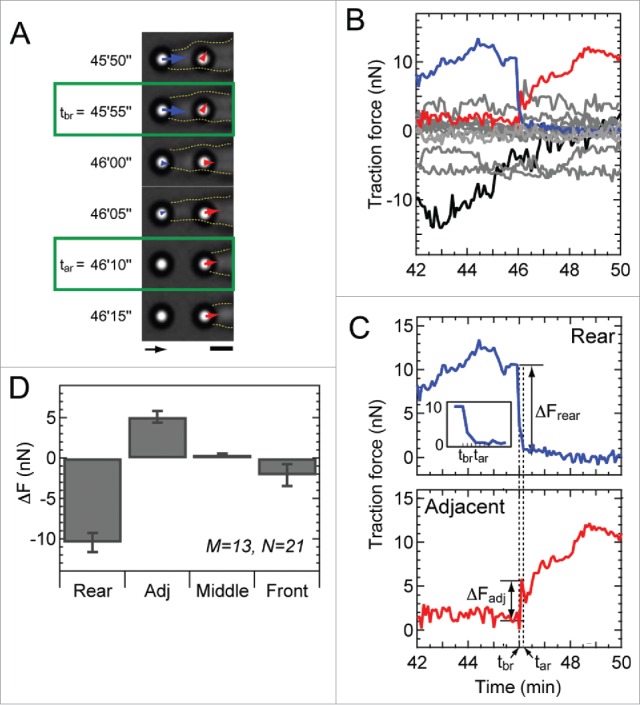
Figure 4.

Rear release coincides with a rise in force at the adjacent micropost. (A) Phase contrast images showing the movement of the cell membrane (yellow dotted line) during rear release. Green boxes indicate the time tbr after which the force at the rear micropost (blue arrow) begins to decrease toward zero, as well as the time tar when the membrane visibly detaches from the micropost. Arrow scale: 10 nN, bar scale: 3 μm. (B) Plot of traction forces at the rear (blue), adjacent to the rear (red), middle (gray) and front microposts (black) over time. (C) Plot of traction forces at the rear (top) and adjacent micropost (bottom) as shown in panel B. Changes in force (ΔFrear for the rear micropost and ΔFadj for the adjacent micropost) were measured in reference to the 2 time points: tbr and tar, shown in panel A. (D) Change in force at the rear, adjacent, middle, and front microposts. Although the changes in force at the adjacent, middle, and rear microposts were all significantly larger than zero (p < 0.01), the changes in force within the middle and rear regions of the cell were much smaller than that at the adjacent micropost (p < 0.00001). M represents the number of analyzed cells, whereas N shows the number of events.
