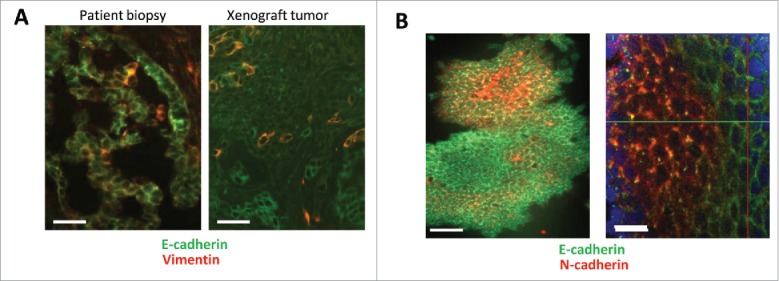
Figure 1.

Immunfluorescence analysis of primary ovarian cancer and human iPS cells. (A) Ovarian cancer cells: Epithelial marker E-cadherin and the mesenchymal marker Vimentin on sections from an ovarian cancer patient biopsy and a xenograft tumor established by transplantation of primary ovarian cancer cells into immunodeficient mice. Green: E-cadherin, Red: Vimentin. The scale bar is 20 μm. (B) iPS cells: Cells were grown on glass slides and stained for the indicated markers. Note that culturing iPS cells on glass slides triggers their differentiation at the periphery of colonies. Green: E-cadherin, Red: N-cadherin. The scale bar is 40 μm in the left panel and 20 μm in the right panel.
