Figure 3.

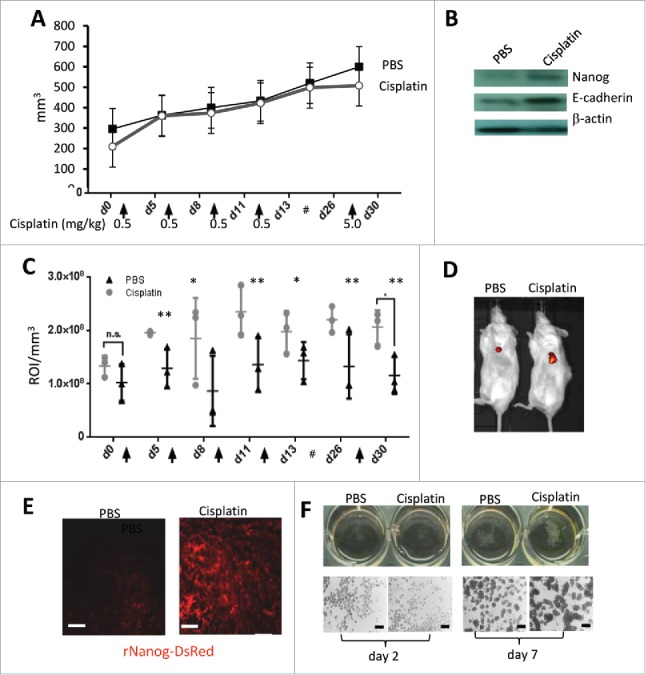
Cisplatin treatment at subtherapeutic doses triggers increase in rNanog/DsRed cells and tumorsphere formation in ovarian cancer xenograft tumors. Ovc-rNanog/DsRed cells were transplanted into the mammary fat pad of CB17 mice. When tumors reached a volume of 200 mm3 mice received intravenous injections of cisplatin at the indicated time points and doses. For the last injection, a dose of 5 mg/kg was used and animals were sacrificed 2 days later. (A) Tumor volume. N = 3. (B) Western blot with Nanog and E-cadherin specific monoclonal antibodies on lysates from tumors that were harvested 2 days after the last cisplatin injection. β-actin serves as a loading control. C and D) DsRed in vivo imaging. (C) Shown is the signal intensity at the region of interest (ROI), i.e., the tumor. The ROI was then normalized to the tumor volume and expressed as signals in ROI/mm3. N = 3; ns-not significant, *p < 0.05, **p < 0.01. The # sign represents a 2 week break before the last treatment. (D) Representative in vivo images taken at day 5 after the first cisplatin injection. (E) DsRed fluorescence on sections from tumors harvested 2 days after the last cisplatin injection. The scale bar is 20 μm. (F) Tumorsphere formation assay. Ovc316 cell were cultured in serum free-medium PRIME-XV Tumorsphere medium with or without cisplatin. Spheres were analyzed at day 2 and day 7. Representative images are shown. The scale bars in the lower panels are 200μm. For day 7 samples, spheres were counted in 3 wells for +/− cisplatin settings.
