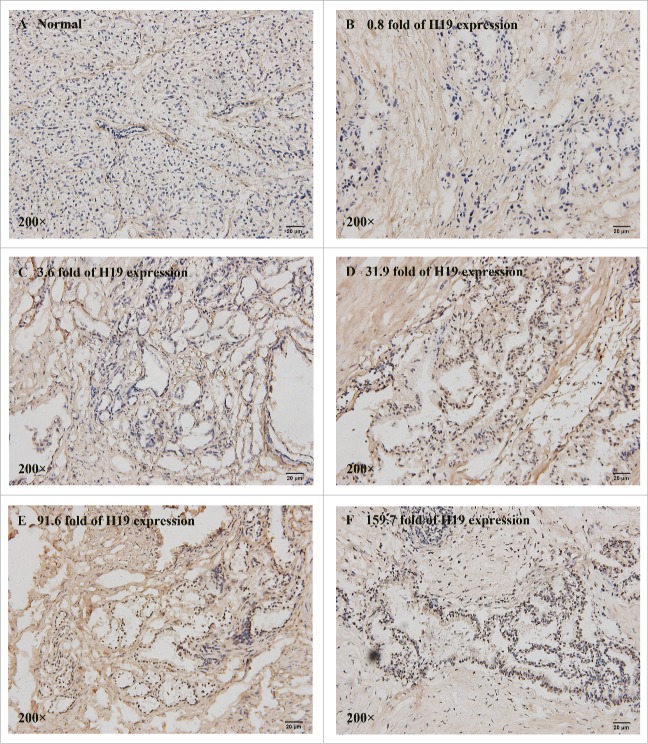
Figure 6.
Correlation of E2F-1 and H19 expression levels in frozen sections of 25 PDAC tissues. The nuclear staining intensity and positively stained cells of E2F-1 were distinctly different in normal pancreatic tissue (A) (IHC score = 0) and PDAC tissues with various H19 level at 0.8-fold (B) (IHC score = 1), 3.6-fold (C) (IHC score = 2), 31.9-fold (D) (IHC score = 4), 91.6-fold (E) (IHC score = 5) and 159.7-fold (F) (IHC score = 6).

