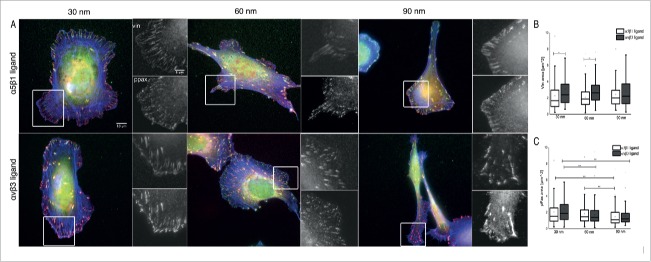
Figure 2.
Focal adhesions in cells adhering to nanopatterned surfaces functionalized with integrin α5β1 and αvβ3 integrin selective ligands. (A) Indirect immunofluorescence staining of vinculin (green), phosphorylated paxillin (red), and actin (blue) in U2OS cells. Insets are a magnification of separate stainings for vinculin and phosphorylated paxillin, in the cell region delineated by the white box. Cells adhering for 4 hr to α5β1 (first row) and αvβ3 integrin selective ligands (second row) at spacings of 30 nm (left), 60 nm (middle), and 90 nm (right) were imaged by wide-field microscopy. (B) Analysis of vinculin cluster size; and (C) Analysis of phosphorylated paxillin (PY118) cluster size in U2OS cells. Box plots indicate cluster area values between 25% and 75%, and whiskers between 10% and 90% of the data range. The line in the box plot indicates the median value. p* < 0.001.

