
Figure 3.
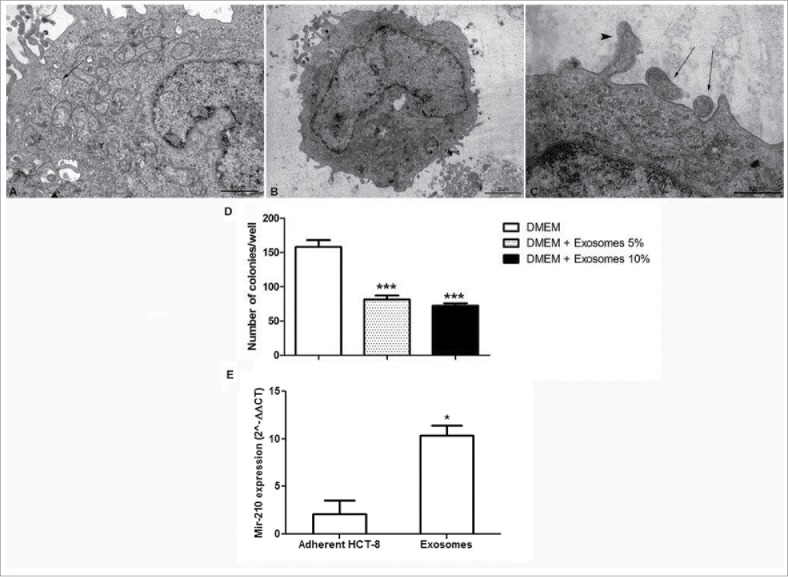
Morphological analysis of exosomes. (Panel A) Transmission electron microscopy of HCT-8 cells showing micro vesicles enclosing bilipidic layer-bound exosomes (black arrow) (20,000X, scale bar 1 µm). (Panel B) Metastatic cell cultured with 10% exosome suspension (10,000X, scale bar 2 µm). (Panel C) Higher magnification of panel B. Two microvescicles are located closed to cell membrane (black arrows), one appears fused with cell membrane (arrow head); (50,000X, scale bar 500 nm). (Panel D) Number of adherent new colonies formed by metastatic cells in the presence and absence of exosomes ***p < 0.001 vs DMEM. (Panel E) miR-210 expression in adherently growing HCT-8 and in exosomes, analyzed using real-time RT-PCR. *p < 0.05.