
Figure 4.
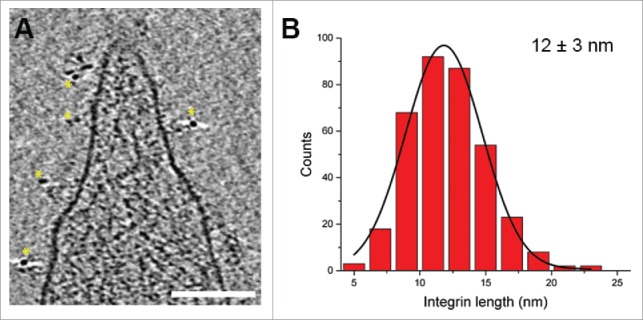
Analysis of platelet membrane receptors. (A) An x-y slice through a tomogram of a platelet, where integrin αIIbβ3 has been immunogold labeled.32 Yellow stars highlight the 6 nm gold nanoparticles, which were observed only in the proximity of the platelet membrane. Scale bar: 100 nm. (B) Histogram of integrin length distribution. The integrin lengths were measured in 5 tomograms (acquired as in Figs. 1C, D) for a total of 366 integrins.32 The black line is a Gaussian fit to the histogram.