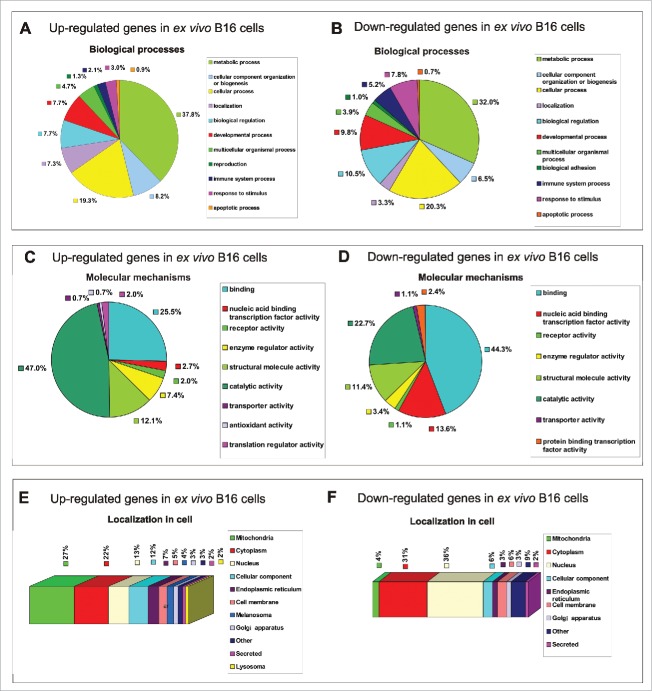
Figure 3.
Functional classification of 277 differentially regulated proteins in ex vivo B16 cells identified in total protein extracts by LC-MS. Protein profile analysis of both in vitro and ex vivo B16 cells was performed by LC-MS, and in vitro B16 cells were used as reference cells. The pie charts demonstrate the distribution of 165 upregulated (left panel) and 112 downregulated (right panel) proteins in ex vivo B16 cells according to their biological processes (A-B) and molecular mechanisms (C-D). Categorizations were based on information provided by the PANTHER classification system (see methods). The subcellular localization prediction of up-regulated (E) and down-regulated (F) proteins in B16 ex vivo cells was annotated manually using the UniProt database. The percentages shown in the pie and bar charts represent the percentage of genes belonging to each group.

