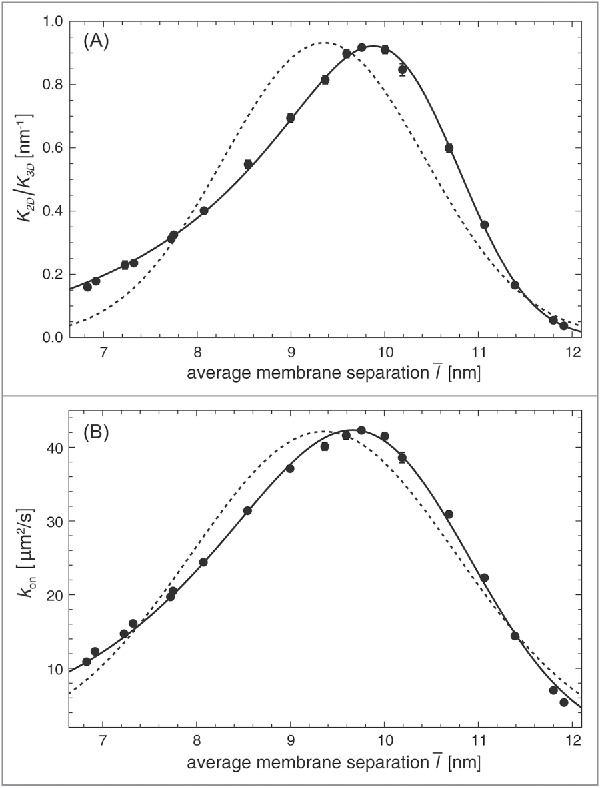
Figure 5.

(A) Ratio of the binding constants of lipid-anchored and soluble receptors and ligands and (B) on-rate constant of lipid-anchored receptors and ligands vs. average membrane separation of 2 membranes with area 14 × 14 nm2 and a single lipid-anchored receptor and ligand in our coarse-grained molecular model. The relative membrane roughness is determined by the membrane area in this system and attains the value nm. The data points result from MD simulations. The full lines in (A) result from a fit of our general theoretical results for from Eqs. (1), (7), and (8) with fit parameters nm2, nm, and for the anchoring strength of our lipid-anchored receptors and ligands. The full lines in (b) result from a fit of our general theoretical results for from Eqs. (9), (10), and (2) with fit parameters , nm, and . The dashed lines represent fits to Eqs. (17) and (18) obtained for the classical Gaussian theory with fit parameters (a) nm2, nm, and nm and (b) , nm, and nm.
